Chickasaw vs Immigrants from Trinidad and Tobago In Labor Force | Age > 16
COMPARE
Chickasaw
Immigrants from Trinidad and Tobago
In Labor Force | Age > 16
In Labor Force | Age > 16 Comparison
Chickasaw
Immigrants from Trinidad and Tobago
62.3%
IN LABOR FORCE | AGE > 16
0.0/ 100
METRIC RATING
318th/ 347
METRIC RANK
64.8%
IN LABOR FORCE | AGE > 16
15.6/ 100
METRIC RATING
209th/ 347
METRIC RANK
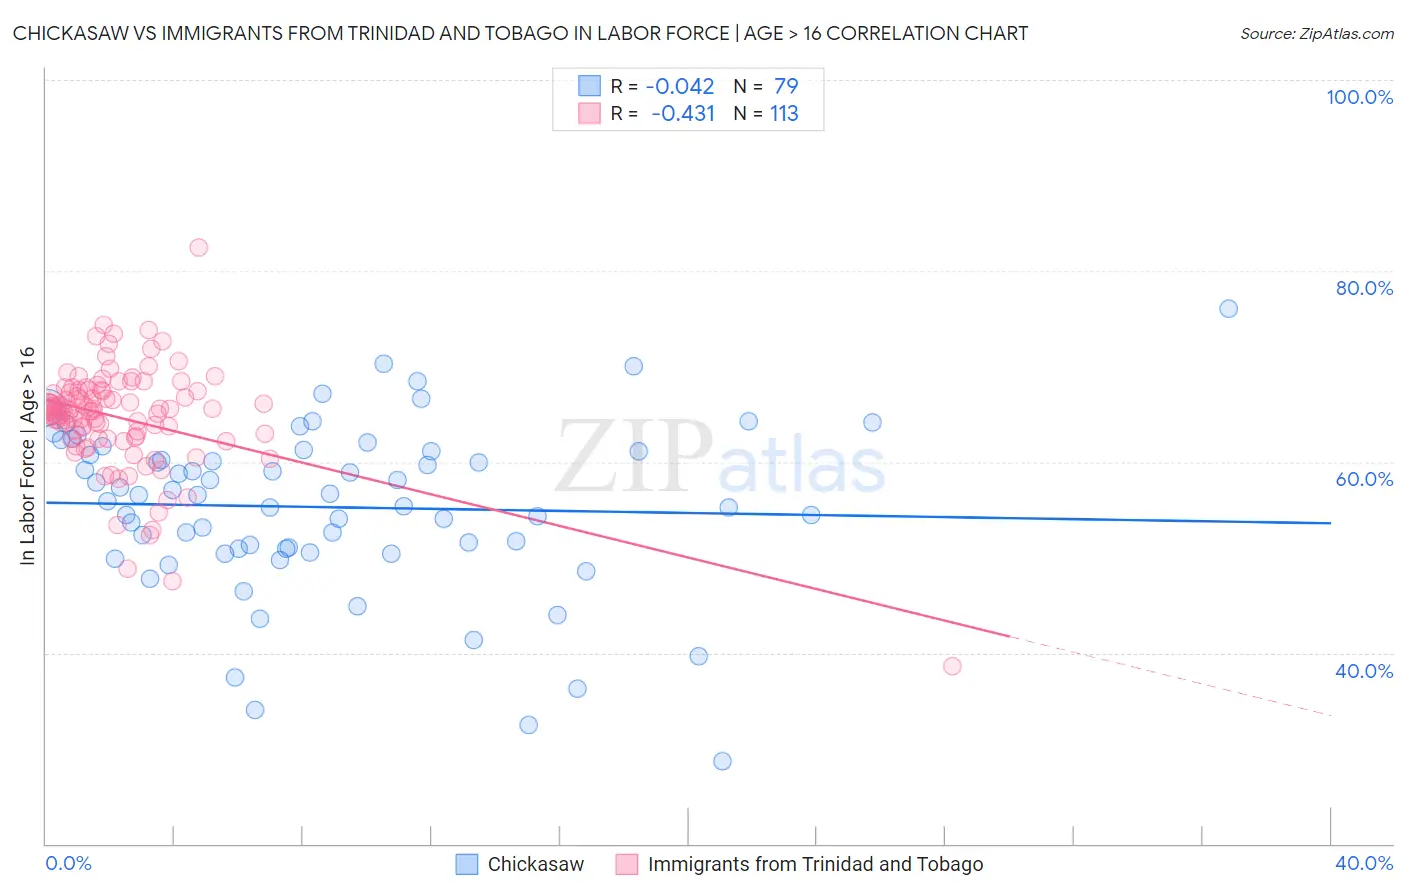
Chickasaw vs Immigrants from Trinidad and Tobago In Labor Force | Age > 16 Correlation Chart
The statistical analysis conducted on geographies consisting of 147,722,257 people shows no correlation between the proportion of Chickasaw and labor force participation rate among population ages 16 and over in the United States with a correlation coefficient (R) of -0.042 and weighted average of 62.3%. Similarly, the statistical analysis conducted on geographies consisting of 223,535,582 people shows a moderate negative correlation between the proportion of Immigrants from Trinidad and Tobago and labor force participation rate among population ages 16 and over in the United States with a correlation coefficient (R) of -0.431 and weighted average of 64.8%, a difference of 4.0%.
In Labor Force | Age > 16 Correlation Summary
| Measurement | Chickasaw | Immigrants from Trinidad and Tobago |
| Minimum | 28.7% | 38.6% |
| Maximum | 76.1% | 82.4% |
| Range | 47.4% | 43.8% |
| Mean | 55.2% | 64.6% |
| Median | 56.5% | 65.5% |
| Interquartile 25% (IQ1) | 50.9% | 62.5% |
| Interquartile 75% (IQ3) | 61.1% | 67.4% |
| Interquartile Range (IQR) | 10.2% | 4.9% |
| Standard Deviation (Sample) | 8.9% | 5.6% |
| Standard Deviation (Population) | 8.8% | 5.6% |
Similar Demographics by In Labor Force | Age > 16
Demographics Similar to Chickasaw by In Labor Force | Age > 16
In terms of in labor force | age > 16, the demographic groups most similar to Chickasaw are Kiowa (62.4%, a difference of 0.19%), Arapaho (62.1%, a difference of 0.24%), Yakama (62.1%, a difference of 0.25%), American (62.1%, a difference of 0.28%), and Ottawa (62.0%, a difference of 0.44%).
| Demographics | Rating | Rank | In Labor Force | Age > 16 |
| Blackfeet | 0.0 /100 | #311 | Tragic 63.2% |
| Iroquois | 0.0 /100 | #312 | Tragic 63.2% |
| Chippewa | 0.0 /100 | #313 | Tragic 63.1% |
| Yaqui | 0.0 /100 | #314 | Tragic 63.0% |
| Potawatomi | 0.0 /100 | #315 | Tragic 62.8% |
| Yup'ik | 0.0 /100 | #316 | Tragic 62.7% |
| Kiowa | 0.0 /100 | #317 | Tragic 62.4% |
| Chickasaw | 0.0 /100 | #318 | Tragic 62.3% |
| Arapaho | 0.0 /100 | #319 | Tragic 62.1% |
| Yakama | 0.0 /100 | #320 | Tragic 62.1% |
| Americans | 0.0 /100 | #321 | Tragic 62.1% |
| Ottawa | 0.0 /100 | #322 | Tragic 62.0% |
| Seminole | 0.0 /100 | #323 | Tragic 62.0% |
| Cheyenne | 0.0 /100 | #324 | Tragic 62.0% |
| Cherokee | 0.0 /100 | #325 | Tragic 61.9% |
Demographics Similar to Immigrants from Trinidad and Tobago by In Labor Force | Age > 16
In terms of in labor force | age > 16, the demographic groups most similar to Immigrants from Trinidad and Tobago are Belizean (64.8%, a difference of 0.010%), Immigrants from Latin America (64.8%, a difference of 0.020%), Immigrants from Denmark (64.8%, a difference of 0.020%), Fijian (64.8%, a difference of 0.030%), and Lithuanian (64.8%, a difference of 0.040%).
| Demographics | Rating | Rank | In Labor Force | Age > 16 |
| Immigrants | Belgium | 19.4 /100 | #202 | Poor 64.9% |
| Russians | 18.8 /100 | #203 | Poor 64.9% |
| Slovenes | 18.7 /100 | #204 | Poor 64.9% |
| Jamaicans | 18.7 /100 | #205 | Poor 64.9% |
| Lithuanians | 17.4 /100 | #206 | Poor 64.8% |
| Immigrants | Latin America | 16.4 /100 | #207 | Poor 64.8% |
| Belizeans | 16.2 /100 | #208 | Poor 64.8% |
| Immigrants | Trinidad and Tobago | 15.6 /100 | #209 | Poor 64.8% |
| Immigrants | Denmark | 14.7 /100 | #210 | Poor 64.8% |
| Fijians | 14.1 /100 | #211 | Poor 64.8% |
| Alaskan Athabascans | 13.9 /100 | #212 | Poor 64.8% |
| Maltese | 13.8 /100 | #213 | Poor 64.8% |
| Estonians | 13.1 /100 | #214 | Poor 64.8% |
| Immigrants | Czechoslovakia | 12.3 /100 | #215 | Poor 64.8% |
| Belgians | 11.4 /100 | #216 | Poor 64.7% |