Zip Codes with the Highest Percentage of Population Employed in Arts, Entertainment & Recreation in Hammond, LA
RELATED REPORTS & OPTIONS
Arts, Entertainment & Recreation
Hammond
Compare Zip Codes
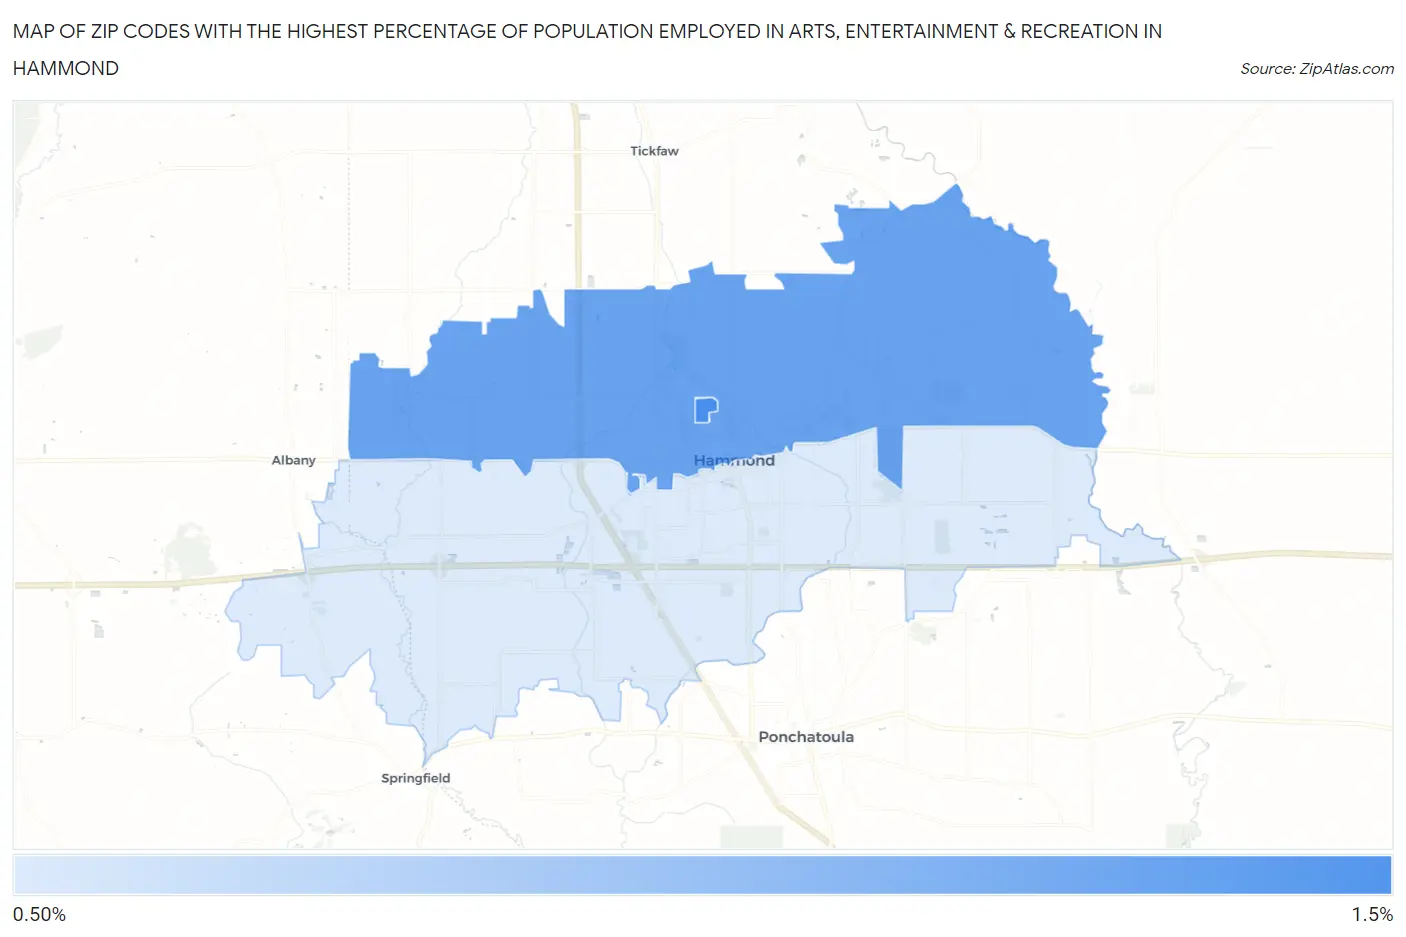
Map of Zip Codes with the Highest Percentage of Population Employed in Arts, Entertainment & Recreation in Hammond
0.79%
1.1%
Zip Codes with the Highest Percentage of Population Employed in Arts, Entertainment & Recreation in Hammond, LA
| Zip Code | % Employed | vs State | vs National | |
| 1. | 70402 | 1.1% | 2.2%(-1.06)#244 | 2.1%(-0.942)#15,932 |
| 2. | 70401 | 1.1% | 2.2%(-1.13)#253 | 2.1%(-1.02)#16,494 |
| 3. | 70403 | 0.79% | 2.2%(-1.41)#275 | 2.1%(-1.29)#18,489 |
1
Common Questions
What are the Top Zip Codes with the Highest Percentage of Population Employed in Arts, Entertainment & Recreation in Hammond, LA?
Top Zip Codes with the Highest Percentage of Population Employed in Arts, Entertainment & Recreation in Hammond, LA are:
What zip code has the Highest Percentage of Population Employed in Arts, Entertainment & Recreation in Hammond, LA?
70402 has the Highest Percentage of Population Employed in Arts, Entertainment & Recreation in Hammond, LA with 1.1%.
What is the Percentage of Population Employed in Arts, Entertainment & Recreation in Hammond, LA?
Percentage of Population Employed in Arts, Entertainment & Recreation in Hammond is 1.1%.
What is the Percentage of Population Employed in Arts, Entertainment & Recreation in Louisiana?
Percentage of Population Employed in Arts, Entertainment & Recreation in Louisiana is 2.2%.
What is the Percentage of Population Employed in Arts, Entertainment & Recreation in the United States?
Percentage of Population Employed in Arts, Entertainment & Recreation in the United States is 2.1%.