Assyrian/Chaldean/Syriac vs Immigrants from Hungary Per Capita Income
COMPARE
Assyrian/Chaldean/Syriac
Immigrants from Hungary
Per Capita Income
Per Capita Income Comparison
Assyrians/Chaldeans/Syriacs
Immigrants from Hungary
$45,195
PER CAPITA INCOME
84.8/ 100
METRIC RATING
138th/ 347
METRIC RANK
$49,303
PER CAPITA INCOME
99.8/ 100
METRIC RATING
72nd/ 347
METRIC RANK
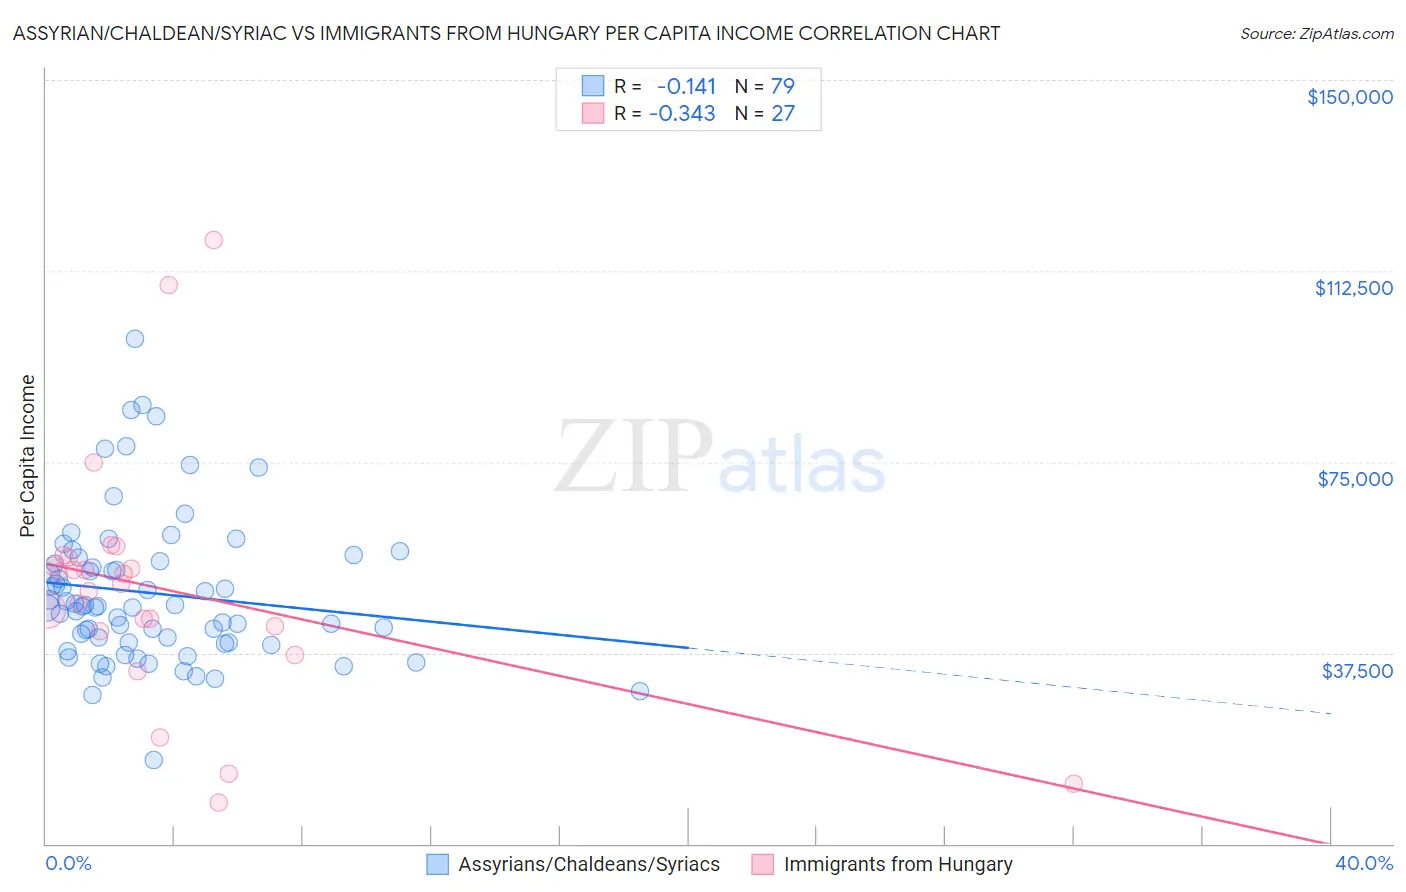
Assyrian/Chaldean/Syriac vs Immigrants from Hungary Per Capita Income Correlation Chart
The statistical analysis conducted on geographies consisting of 110,311,560 people shows a poor negative correlation between the proportion of Assyrians/Chaldeans/Syriacs and per capita income in the United States with a correlation coefficient (R) of -0.141 and weighted average of $45,195. Similarly, the statistical analysis conducted on geographies consisting of 195,712,632 people shows a mild negative correlation between the proportion of Immigrants from Hungary and per capita income in the United States with a correlation coefficient (R) of -0.343 and weighted average of $49,303, a difference of 9.1%.
Per Capita Income Correlation Summary
| Measurement | Assyrian/Chaldean/Syriac | Immigrants from Hungary |
| Minimum | $16,468 | $8,083 |
| Maximum | $99,080 | $118,659 |
| Range | $82,612 | $110,576 |
| Mean | $49,218 | $49,900 |
| Median | $46,715 | $51,036 |
| Interquartile 25% (IQ1) | $39,451 | $41,686 |
| Interquartile 75% (IQ3) | $55,554 | $56,245 |
| Interquartile Range (IQR) | $16,103 | $14,559 |
| Standard Deviation (Sample) | $14,590 | $24,211 |
| Standard Deviation (Population) | $14,497 | $23,759 |
Similar Demographics by Per Capita Income
Demographics Similar to Assyrians/Chaldeans/Syriacs by Per Capita Income
In terms of per capita income, the demographic groups most similar to Assyrians/Chaldeans/Syriacs are Immigrants from Syria ($45,218, a difference of 0.050%), Immigrants from Oceania ($45,220, a difference of 0.060%), Basque ($45,086, a difference of 0.24%), Immigrants from Jordan ($45,066, a difference of 0.29%), and Slavic ($45,049, a difference of 0.32%).
| Demographics | Rating | Rank | Per Capita Income |
| Immigrants | North Macedonia | 90.0 /100 | #131 | Exceptional $45,622 |
| Jordanians | 89.9 /100 | #132 | Excellent $45,605 |
| Pakistanis | 89.7 /100 | #133 | Excellent $45,587 |
| Slovenes | 89.6 /100 | #134 | Excellent $45,581 |
| Hungarians | 87.9 /100 | #135 | Excellent $45,426 |
| Immigrants | Oceania | 85.2 /100 | #136 | Excellent $45,220 |
| Immigrants | Syria | 85.2 /100 | #137 | Excellent $45,218 |
| Assyrians/Chaldeans/Syriacs | 84.8 /100 | #138 | Excellent $45,195 |
| Basques | 83.2 /100 | #139 | Excellent $45,086 |
| Immigrants | Jordan | 82.9 /100 | #140 | Excellent $45,066 |
| Slavs | 82.6 /100 | #141 | Excellent $45,049 |
| Ugandans | 82.6 /100 | #142 | Excellent $45,047 |
| Immigrants | Uganda | 82.5 /100 | #143 | Excellent $45,043 |
| Icelanders | 81.6 /100 | #144 | Excellent $44,987 |
| Immigrants | Afghanistan | 78.0 /100 | #145 | Good $44,790 |
Demographics Similar to Immigrants from Hungary by Per Capita Income
In terms of per capita income, the demographic groups most similar to Immigrants from Hungary are Immigrants from North America ($49,302, a difference of 0.0%), Greek ($49,309, a difference of 0.010%), Immigrants from Eastern Europe ($49,316, a difference of 0.030%), Immigrants from Canada ($49,412, a difference of 0.22%), and Mongolian ($49,173, a difference of 0.26%).
| Demographics | Rating | Rank | Per Capita Income |
| Bolivians | 99.9 /100 | #65 | Exceptional $49,526 |
| Immigrants | Bulgaria | 99.9 /100 | #66 | Exceptional $49,482 |
| Immigrants | Romania | 99.9 /100 | #67 | Exceptional $49,463 |
| Lithuanians | 99.8 /100 | #68 | Exceptional $49,448 |
| Immigrants | Canada | 99.8 /100 | #69 | Exceptional $49,412 |
| Immigrants | Eastern Europe | 99.8 /100 | #70 | Exceptional $49,316 |
| Greeks | 99.8 /100 | #71 | Exceptional $49,309 |
| Immigrants | Hungary | 99.8 /100 | #72 | Exceptional $49,303 |
| Immigrants | North America | 99.8 /100 | #73 | Exceptional $49,302 |
| Mongolians | 99.8 /100 | #74 | Exceptional $49,173 |
| Immigrants | Bolivia | 99.7 /100 | #75 | Exceptional $48,970 |
| Immigrants | England | 99.7 /100 | #76 | Exceptional $48,844 |
| Immigrants | Kazakhstan | 99.7 /100 | #77 | Exceptional $48,747 |
| Immigrants | Italy | 99.6 /100 | #78 | Exceptional $48,654 |
| Romanians | 99.5 /100 | #79 | Exceptional $48,445 |