Zimbabwean vs Sierra Leonean Median Earnings
COMPARE
Zimbabwean
Sierra Leonean
Median Earnings
Median Earnings Comparison
Zimbabweans
Sierra Leoneans
$48,229
MEDIAN EARNINGS
92.6/ 100
METRIC RATING
130th/ 347
METRIC RANK
$48,286
MEDIAN EARNINGS
93.1/ 100
METRIC RATING
127th/ 347
METRIC RANK
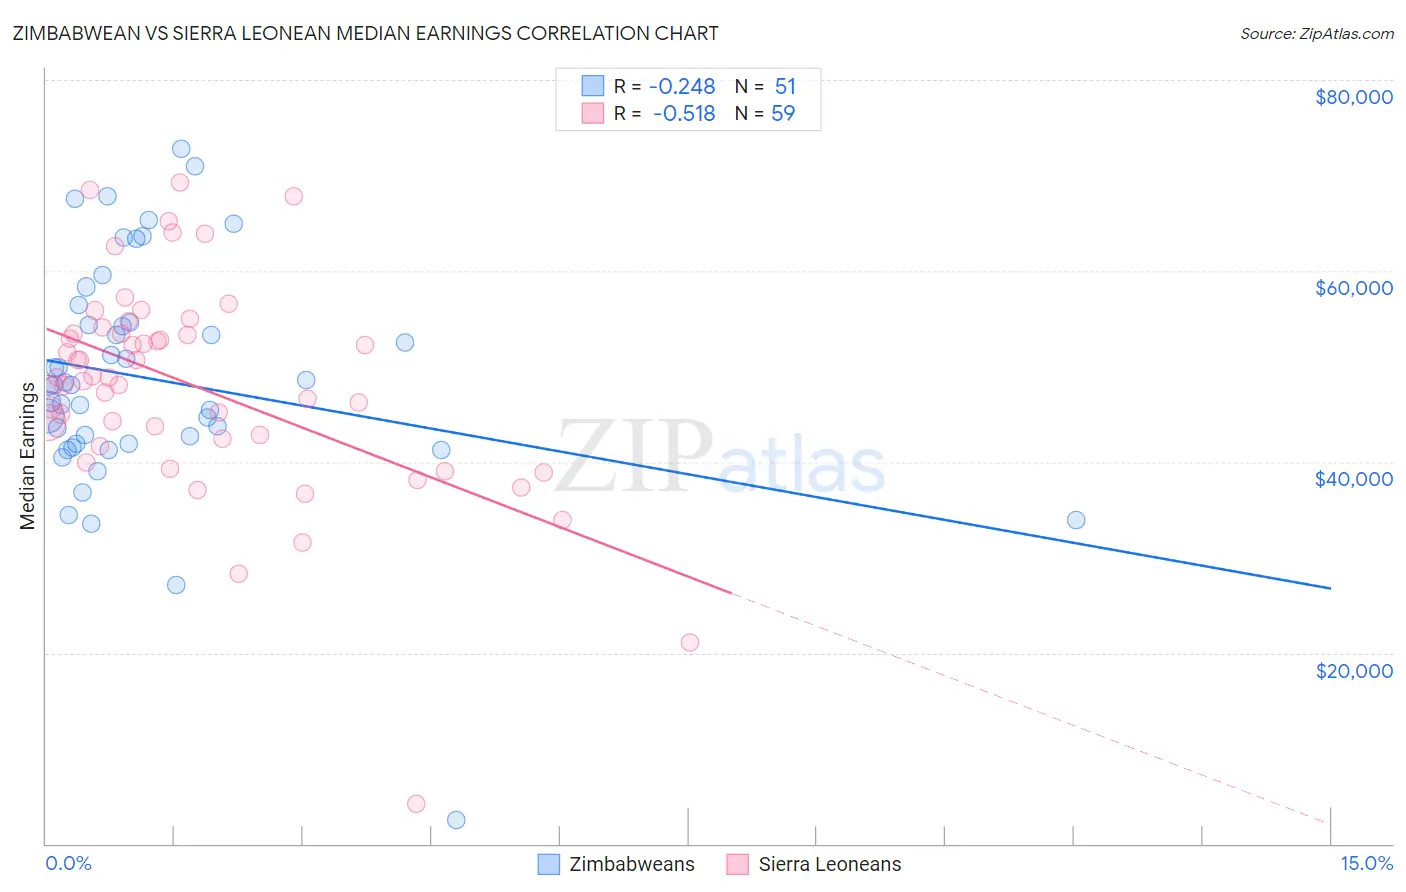
Zimbabwean vs Sierra Leonean Median Earnings Correlation Chart
The statistical analysis conducted on geographies consisting of 69,206,617 people shows a weak negative correlation between the proportion of Zimbabweans and median earnings in the United States with a correlation coefficient (R) of -0.248 and weighted average of $48,229. Similarly, the statistical analysis conducted on geographies consisting of 83,350,653 people shows a substantial negative correlation between the proportion of Sierra Leoneans and median earnings in the United States with a correlation coefficient (R) of -0.518 and weighted average of $48,286, a difference of 0.12%.
Median Earnings Correlation Summary
| Measurement | Zimbabwean | Sierra Leonean |
| Minimum | $2,499 | $4,235 |
| Maximum | $72,836 | $69,241 |
| Range | $70,337 | $65,006 |
| Mean | $48,668 | $47,947 |
| Median | $48,062 | $48,865 |
| Interquartile 25% (IQ1) | $41,953 | $42,439 |
| Interquartile 75% (IQ3) | $54,537 | $53,466 |
| Interquartile Range (IQR) | $12,584 | $11,027 |
| Standard Deviation (Sample) | $12,230 | $11,282 |
| Standard Deviation (Population) | $12,110 | $11,186 |
Demographics Similar to Zimbabweans and Sierra Leoneans by Median Earnings
In terms of median earnings, the demographic groups most similar to Zimbabweans are Lebanese ($48,226, a difference of 0.010%), Pakistani ($48,254, a difference of 0.050%), Immigrants from Philippines ($48,266, a difference of 0.080%), British ($48,189, a difference of 0.080%), and Immigrants from Fiji ($48,305, a difference of 0.16%). Similarly, the demographic groups most similar to Sierra Leoneans are Immigrants from Fiji ($48,305, a difference of 0.040%), Assyrian/Chaldean/Syriac ($48,304, a difference of 0.040%), Immigrants from Philippines ($48,266, a difference of 0.040%), Pakistani ($48,254, a difference of 0.070%), and Lebanese ($48,226, a difference of 0.12%).
| Demographics | Rating | Rank | Median Earnings |
| Immigrants | Jordan | 95.9 /100 | #118 | Exceptional $48,673 |
| Poles | 95.8 /100 | #119 | Exceptional $48,659 |
| Carpatho Rusyns | 95.5 /100 | #120 | Exceptional $48,617 |
| Arabs | 95.4 /100 | #121 | Exceptional $48,599 |
| Chileans | 94.8 /100 | #122 | Exceptional $48,504 |
| Immigrants | Syria | 93.9 /100 | #123 | Exceptional $48,375 |
| Brazilians | 93.7 /100 | #124 | Exceptional $48,356 |
| Immigrants | Fiji | 93.3 /100 | #125 | Exceptional $48,305 |
| Assyrians/Chaldeans/Syriacs | 93.3 /100 | #126 | Exceptional $48,304 |
| Sierra Leoneans | 93.1 /100 | #127 | Exceptional $48,286 |
| Immigrants | Philippines | 92.9 /100 | #128 | Exceptional $48,266 |
| Pakistanis | 92.8 /100 | #129 | Exceptional $48,254 |
| Zimbabweans | 92.6 /100 | #130 | Exceptional $48,229 |
| Lebanese | 92.5 /100 | #131 | Exceptional $48,226 |
| British | 92.2 /100 | #132 | Exceptional $48,189 |
| Immigrants | Uganda | 90.5 /100 | #133 | Exceptional $48,041 |
| Sri Lankans | 90.5 /100 | #134 | Exceptional $48,040 |
| Portuguese | 90.4 /100 | #135 | Exceptional $48,032 |
| Slovenes | 90.0 /100 | #136 | Excellent $47,995 |
| Immigrants | Nepal | 89.0 /100 | #137 | Excellent $47,925 |
| Europeans | 88.9 /100 | #138 | Excellent $47,915 |