Zimbabwean vs Slavic Median Earnings
COMPARE
Zimbabwean
Slavic
Median Earnings
Median Earnings Comparison
Zimbabweans
Slavs
$48,229
MEDIAN EARNINGS
92.6/ 100
METRIC RATING
130th/ 347
METRIC RANK
$47,470
MEDIAN EARNINGS
81.1/ 100
METRIC RATING
153rd/ 347
METRIC RANK
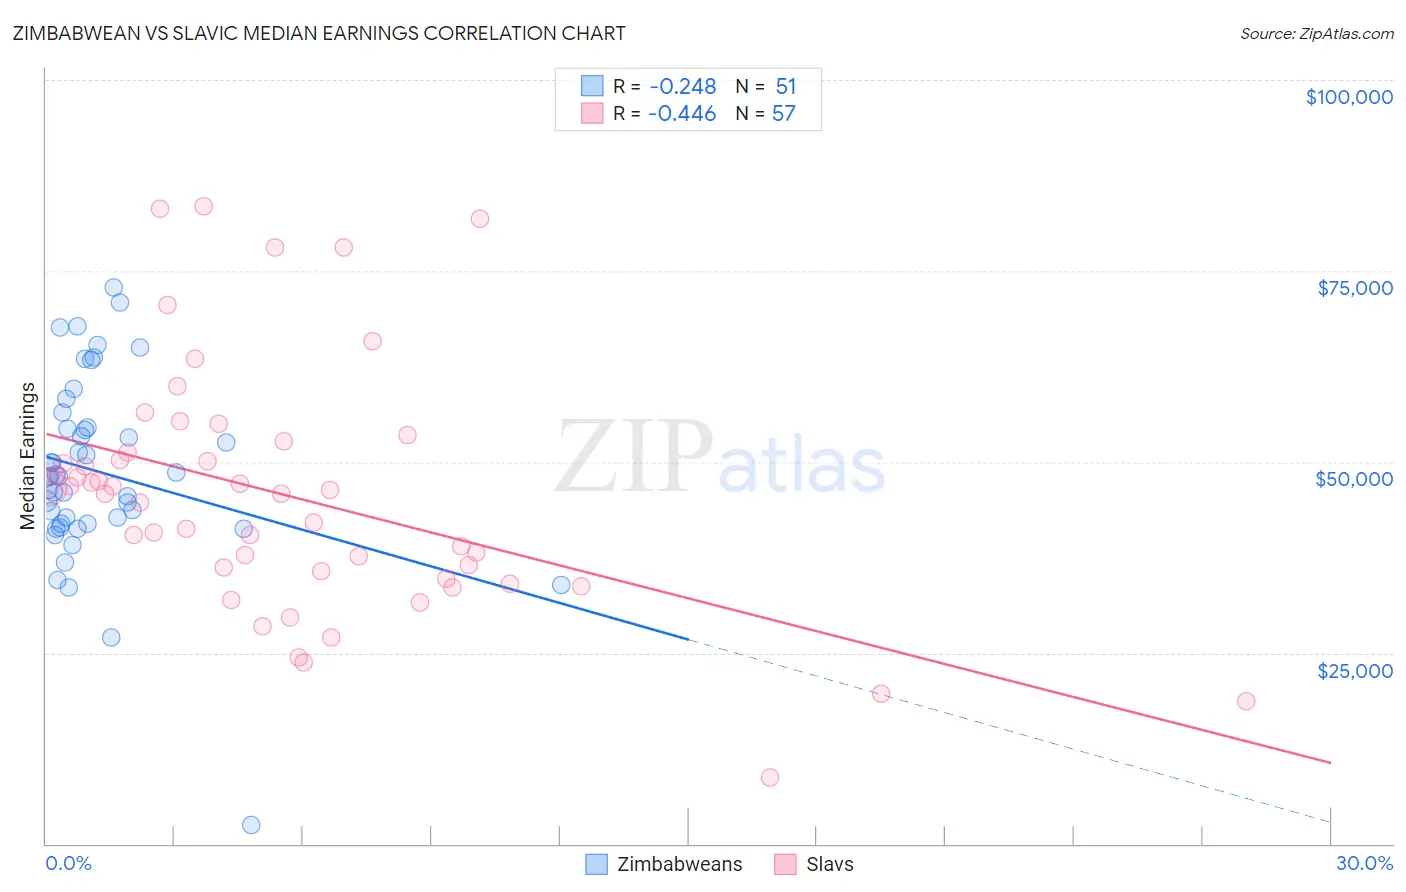
Zimbabwean vs Slavic Median Earnings Correlation Chart
The statistical analysis conducted on geographies consisting of 69,206,617 people shows a weak negative correlation between the proportion of Zimbabweans and median earnings in the United States with a correlation coefficient (R) of -0.248 and weighted average of $48,229. Similarly, the statistical analysis conducted on geographies consisting of 270,868,378 people shows a moderate negative correlation between the proportion of Slavs and median earnings in the United States with a correlation coefficient (R) of -0.446 and weighted average of $47,470, a difference of 1.6%.
Median Earnings Correlation Summary
| Measurement | Zimbabwean | Slavic |
| Minimum | $2,499 | $8,672 |
| Maximum | $72,836 | $83,496 |
| Range | $70,337 | $74,824 |
| Mean | $48,668 | $45,520 |
| Median | $48,062 | $45,848 |
| Interquartile 25% (IQ1) | $41,953 | $35,213 |
| Interquartile 75% (IQ3) | $54,537 | $51,961 |
| Interquartile Range (IQR) | $12,584 | $16,749 |
| Standard Deviation (Sample) | $12,230 | $16,076 |
| Standard Deviation (Population) | $12,110 | $15,935 |
Similar Demographics by Median Earnings
Demographics Similar to Zimbabweans by Median Earnings
In terms of median earnings, the demographic groups most similar to Zimbabweans are Lebanese ($48,226, a difference of 0.010%), Pakistani ($48,254, a difference of 0.050%), Immigrants from Philippines ($48,266, a difference of 0.080%), British ($48,189, a difference of 0.080%), and Sierra Leonean ($48,286, a difference of 0.12%).
| Demographics | Rating | Rank | Median Earnings |
| Immigrants | Syria | 93.9 /100 | #123 | Exceptional $48,375 |
| Brazilians | 93.7 /100 | #124 | Exceptional $48,356 |
| Immigrants | Fiji | 93.3 /100 | #125 | Exceptional $48,305 |
| Assyrians/Chaldeans/Syriacs | 93.3 /100 | #126 | Exceptional $48,304 |
| Sierra Leoneans | 93.1 /100 | #127 | Exceptional $48,286 |
| Immigrants | Philippines | 92.9 /100 | #128 | Exceptional $48,266 |
| Pakistanis | 92.8 /100 | #129 | Exceptional $48,254 |
| Zimbabweans | 92.6 /100 | #130 | Exceptional $48,229 |
| Lebanese | 92.5 /100 | #131 | Exceptional $48,226 |
| British | 92.2 /100 | #132 | Exceptional $48,189 |
| Immigrants | Uganda | 90.5 /100 | #133 | Exceptional $48,041 |
| Sri Lankans | 90.5 /100 | #134 | Exceptional $48,040 |
| Portuguese | 90.4 /100 | #135 | Exceptional $48,032 |
| Slovenes | 90.0 /100 | #136 | Excellent $47,995 |
| Immigrants | Nepal | 89.0 /100 | #137 | Excellent $47,925 |
Demographics Similar to Slavs by Median Earnings
In terms of median earnings, the demographic groups most similar to Slavs are Immigrants from Germany ($47,566, a difference of 0.20%), Immigrants from Oceania ($47,617, a difference of 0.31%), Peruvian ($47,628, a difference of 0.33%), Immigrants from Portugal ($47,304, a difference of 0.35%), and Luxembourger ($47,640, a difference of 0.36%).
| Demographics | Rating | Rank | Median Earnings |
| Immigrants | Chile | 85.5 /100 | #146 | Excellent $47,697 |
| Immigrants | South Eastern Asia | 85.0 /100 | #147 | Excellent $47,671 |
| Immigrants | Eritrea | 84.8 /100 | #148 | Excellent $47,657 |
| Luxembourgers | 84.5 /100 | #149 | Excellent $47,640 |
| Peruvians | 84.2 /100 | #150 | Excellent $47,628 |
| Immigrants | Oceania | 84.1 /100 | #151 | Excellent $47,617 |
| Immigrants | Germany | 83.1 /100 | #152 | Excellent $47,566 |
| Slavs | 81.1 /100 | #153 | Excellent $47,470 |
| Immigrants | Portugal | 77.3 /100 | #154 | Good $47,304 |
| Immigrants | Vietnam | 76.7 /100 | #155 | Good $47,282 |
| Irish | 76.6 /100 | #156 | Good $47,276 |
| Czechs | 75.1 /100 | #157 | Good $47,221 |
| Slovaks | 71.7 /100 | #158 | Good $47,095 |
| Immigrants | Peru | 69.6 /100 | #159 | Good $47,025 |
| Alsatians | 69.6 /100 | #160 | Good $47,023 |