Zimbabwean vs Bahamian Median Earnings
COMPARE
Zimbabwean
Bahamian
Median Earnings
Median Earnings Comparison
Zimbabweans
Bahamians
$48,229
MEDIAN EARNINGS
92.6/ 100
METRIC RATING
130th/ 347
METRIC RANK
$39,735
MEDIAN EARNINGS
0.0/ 100
METRIC RATING
323rd/ 347
METRIC RANK
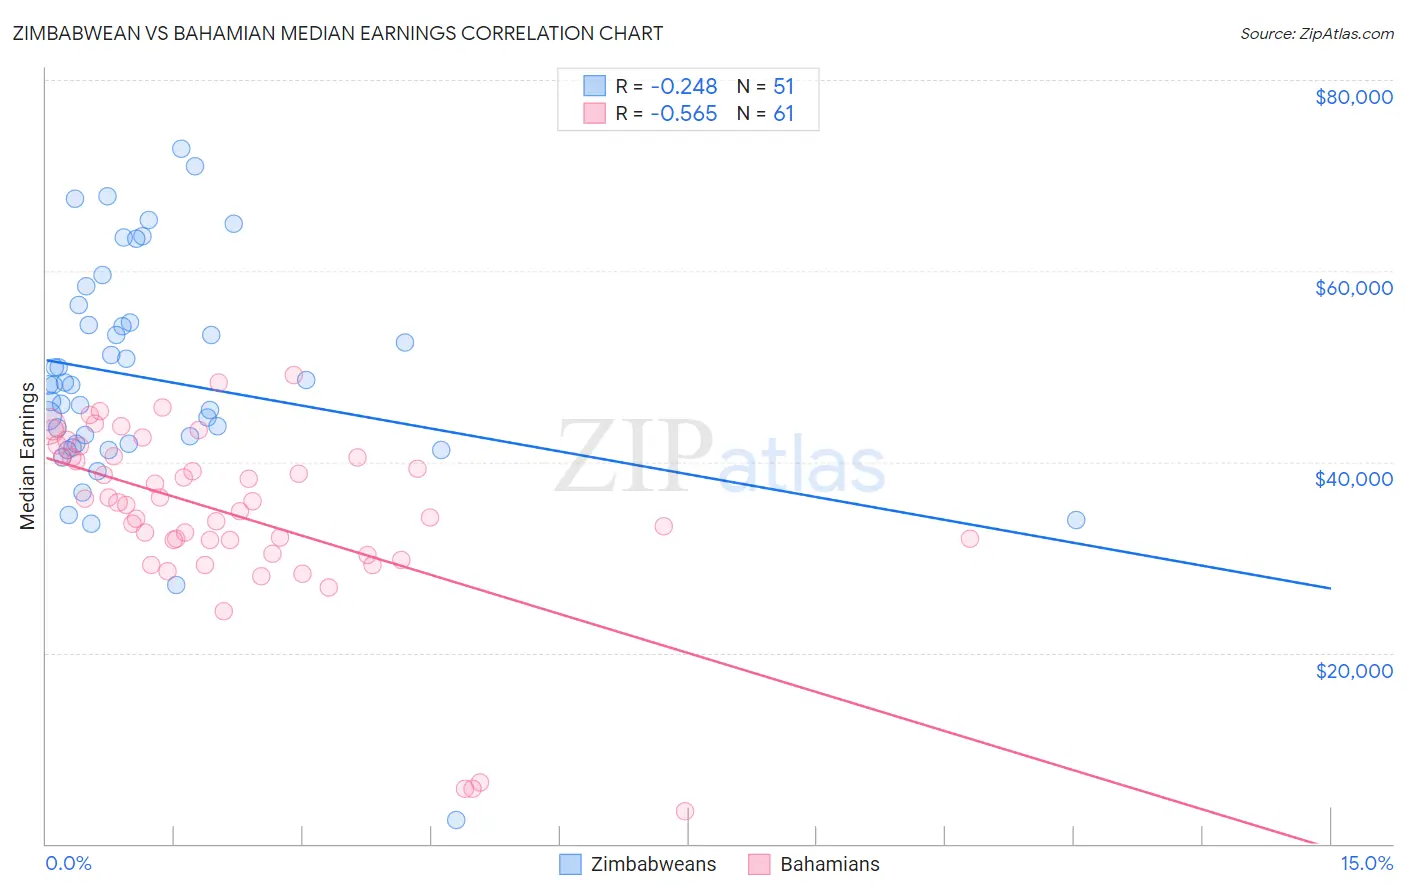
Zimbabwean vs Bahamian Median Earnings Correlation Chart
The statistical analysis conducted on geographies consisting of 69,206,617 people shows a weak negative correlation between the proportion of Zimbabweans and median earnings in the United States with a correlation coefficient (R) of -0.248 and weighted average of $48,229. Similarly, the statistical analysis conducted on geographies consisting of 112,703,764 people shows a substantial negative correlation between the proportion of Bahamians and median earnings in the United States with a correlation coefficient (R) of -0.565 and weighted average of $39,735, a difference of 21.4%.
Median Earnings Correlation Summary
| Measurement | Zimbabwean | Bahamian |
| Minimum | $2,499 | $3,467 |
| Maximum | $72,836 | $49,150 |
| Range | $70,337 | $45,683 |
| Mean | $48,668 | $34,478 |
| Median | $48,062 | $35,694 |
| Interquartile 25% (IQ1) | $41,953 | $31,085 |
| Interquartile 75% (IQ3) | $54,537 | $40,552 |
| Interquartile Range (IQR) | $12,584 | $9,467 |
| Standard Deviation (Sample) | $12,230 | $9,647 |
| Standard Deviation (Population) | $12,110 | $9,567 |
Similar Demographics by Median Earnings
Demographics Similar to Zimbabweans by Median Earnings
In terms of median earnings, the demographic groups most similar to Zimbabweans are Lebanese ($48,226, a difference of 0.010%), Pakistani ($48,254, a difference of 0.050%), Immigrants from Philippines ($48,266, a difference of 0.080%), British ($48,189, a difference of 0.080%), and Sierra Leonean ($48,286, a difference of 0.12%).
| Demographics | Rating | Rank | Median Earnings |
| Immigrants | Syria | 93.9 /100 | #123 | Exceptional $48,375 |
| Brazilians | 93.7 /100 | #124 | Exceptional $48,356 |
| Immigrants | Fiji | 93.3 /100 | #125 | Exceptional $48,305 |
| Assyrians/Chaldeans/Syriacs | 93.3 /100 | #126 | Exceptional $48,304 |
| Sierra Leoneans | 93.1 /100 | #127 | Exceptional $48,286 |
| Immigrants | Philippines | 92.9 /100 | #128 | Exceptional $48,266 |
| Pakistanis | 92.8 /100 | #129 | Exceptional $48,254 |
| Zimbabweans | 92.6 /100 | #130 | Exceptional $48,229 |
| Lebanese | 92.5 /100 | #131 | Exceptional $48,226 |
| British | 92.2 /100 | #132 | Exceptional $48,189 |
| Immigrants | Uganda | 90.5 /100 | #133 | Exceptional $48,041 |
| Sri Lankans | 90.5 /100 | #134 | Exceptional $48,040 |
| Portuguese | 90.4 /100 | #135 | Exceptional $48,032 |
| Slovenes | 90.0 /100 | #136 | Excellent $47,995 |
| Immigrants | Nepal | 89.0 /100 | #137 | Excellent $47,925 |
Demographics Similar to Bahamians by Median Earnings
In terms of median earnings, the demographic groups most similar to Bahamians are Ottawa ($39,721, a difference of 0.040%), Immigrants from Central America ($39,762, a difference of 0.070%), Creek ($39,648, a difference of 0.22%), Mexican ($39,834, a difference of 0.25%), and Immigrants from Bahamas ($39,861, a difference of 0.32%).
| Demographics | Rating | Rank | Median Earnings |
| Immigrants | Honduras | 0.0 /100 | #316 | Tragic $40,195 |
| Fijians | 0.0 /100 | #317 | Tragic $40,193 |
| Dutch West Indians | 0.0 /100 | #318 | Tragic $40,107 |
| Blacks/African Americans | 0.0 /100 | #319 | Tragic $40,085 |
| Immigrants | Bahamas | 0.0 /100 | #320 | Tragic $39,861 |
| Mexicans | 0.0 /100 | #321 | Tragic $39,834 |
| Immigrants | Central America | 0.0 /100 | #322 | Tragic $39,762 |
| Bahamians | 0.0 /100 | #323 | Tragic $39,735 |
| Ottawa | 0.0 /100 | #324 | Tragic $39,721 |
| Creek | 0.0 /100 | #325 | Tragic $39,648 |
| Immigrants | Yemen | 0.0 /100 | #326 | Tragic $39,540 |
| Yuman | 0.0 /100 | #327 | Tragic $39,523 |
| Sioux | 0.0 /100 | #328 | Tragic $39,448 |
| Kiowa | 0.0 /100 | #329 | Tragic $39,232 |
| Immigrants | Congo | 0.0 /100 | #330 | Tragic $39,169 |