Zimbabwean vs Immigrants from Cuba Median Earnings
COMPARE
Zimbabwean
Immigrants from Cuba
Median Earnings
Median Earnings Comparison
Zimbabweans
Immigrants from Cuba
$48,229
MEDIAN EARNINGS
92.6/ 100
METRIC RATING
130th/ 347
METRIC RANK
$38,426
MEDIAN EARNINGS
0.0/ 100
METRIC RATING
337th/ 347
METRIC RANK
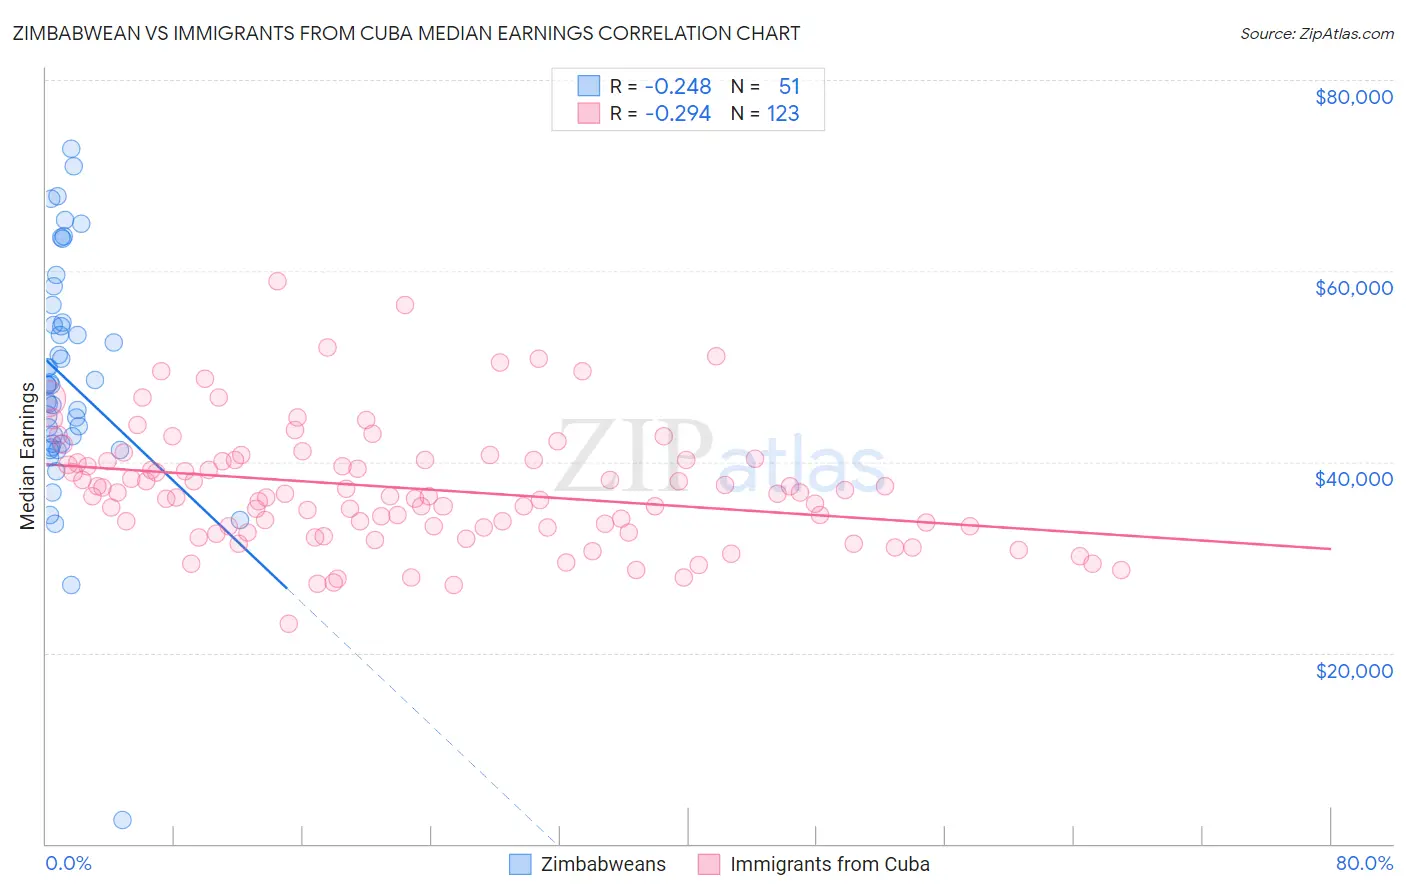
Zimbabwean vs Immigrants from Cuba Median Earnings Correlation Chart
The statistical analysis conducted on geographies consisting of 69,206,617 people shows a weak negative correlation between the proportion of Zimbabweans and median earnings in the United States with a correlation coefficient (R) of -0.248 and weighted average of $48,229. Similarly, the statistical analysis conducted on geographies consisting of 326,004,649 people shows a weak negative correlation between the proportion of Immigrants from Cuba and median earnings in the United States with a correlation coefficient (R) of -0.294 and weighted average of $38,426, a difference of 25.5%.
Median Earnings Correlation Summary
| Measurement | Zimbabwean | Immigrants from Cuba |
| Minimum | $2,499 | $23,000 |
| Maximum | $72,836 | $58,885 |
| Range | $70,337 | $35,885 |
| Mean | $48,668 | $37,187 |
| Median | $48,062 | $36,411 |
| Interquartile 25% (IQ1) | $41,953 | $33,147 |
| Interquartile 75% (IQ3) | $54,537 | $40,226 |
| Interquartile Range (IQR) | $12,584 | $7,079 |
| Standard Deviation (Sample) | $12,230 | $6,277 |
| Standard Deviation (Population) | $12,110 | $6,251 |
Similar Demographics by Median Earnings
Demographics Similar to Zimbabweans by Median Earnings
In terms of median earnings, the demographic groups most similar to Zimbabweans are Lebanese ($48,226, a difference of 0.010%), Pakistani ($48,254, a difference of 0.050%), Immigrants from Philippines ($48,266, a difference of 0.080%), British ($48,189, a difference of 0.080%), and Sierra Leonean ($48,286, a difference of 0.12%).
| Demographics | Rating | Rank | Median Earnings |
| Immigrants | Syria | 93.9 /100 | #123 | Exceptional $48,375 |
| Brazilians | 93.7 /100 | #124 | Exceptional $48,356 |
| Immigrants | Fiji | 93.3 /100 | #125 | Exceptional $48,305 |
| Assyrians/Chaldeans/Syriacs | 93.3 /100 | #126 | Exceptional $48,304 |
| Sierra Leoneans | 93.1 /100 | #127 | Exceptional $48,286 |
| Immigrants | Philippines | 92.9 /100 | #128 | Exceptional $48,266 |
| Pakistanis | 92.8 /100 | #129 | Exceptional $48,254 |
| Zimbabweans | 92.6 /100 | #130 | Exceptional $48,229 |
| Lebanese | 92.5 /100 | #131 | Exceptional $48,226 |
| British | 92.2 /100 | #132 | Exceptional $48,189 |
| Immigrants | Uganda | 90.5 /100 | #133 | Exceptional $48,041 |
| Sri Lankans | 90.5 /100 | #134 | Exceptional $48,040 |
| Portuguese | 90.4 /100 | #135 | Exceptional $48,032 |
| Slovenes | 90.0 /100 | #136 | Excellent $47,995 |
| Immigrants | Nepal | 89.0 /100 | #137 | Excellent $47,925 |
Demographics Similar to Immigrants from Cuba by Median Earnings
In terms of median earnings, the demographic groups most similar to Immigrants from Cuba are Pima ($38,285, a difference of 0.37%), Crow ($38,707, a difference of 0.73%), Native/Alaskan ($38,896, a difference of 1.2%), Spanish American Indian ($38,907, a difference of 1.3%), and Houma ($38,949, a difference of 1.4%).
| Demographics | Rating | Rank | Median Earnings |
| Immigrants | Congo | 0.0 /100 | #330 | Tragic $39,169 |
| Immigrants | Mexico | 0.0 /100 | #331 | Tragic $39,114 |
| Yakama | 0.0 /100 | #332 | Tragic $39,107 |
| Houma | 0.0 /100 | #333 | Tragic $38,949 |
| Spanish American Indians | 0.0 /100 | #334 | Tragic $38,907 |
| Natives/Alaskans | 0.0 /100 | #335 | Tragic $38,896 |
| Crow | 0.0 /100 | #336 | Tragic $38,707 |
| Immigrants | Cuba | 0.0 /100 | #337 | Tragic $38,426 |
| Pima | 0.0 /100 | #338 | Tragic $38,285 |
| Menominee | 0.0 /100 | #339 | Tragic $37,884 |
| Navajo | 0.0 /100 | #340 | Tragic $36,999 |
| Lumbee | 0.0 /100 | #341 | Tragic $36,876 |
| Hopi | 0.0 /100 | #342 | Tragic $36,871 |
| Pueblo | 0.0 /100 | #343 | Tragic $36,859 |
| Arapaho | 0.0 /100 | #344 | Tragic $36,586 |