Zimbabwean vs Immigrants from Somalia Median Earnings
COMPARE
Zimbabwean
Immigrants from Somalia
Median Earnings
Median Earnings Comparison
Zimbabweans
Immigrants from Somalia
$48,229
MEDIAN EARNINGS
92.6/ 100
METRIC RATING
130th/ 347
METRIC RANK
$43,100
MEDIAN EARNINGS
0.9/ 100
METRIC RATING
260th/ 347
METRIC RANK
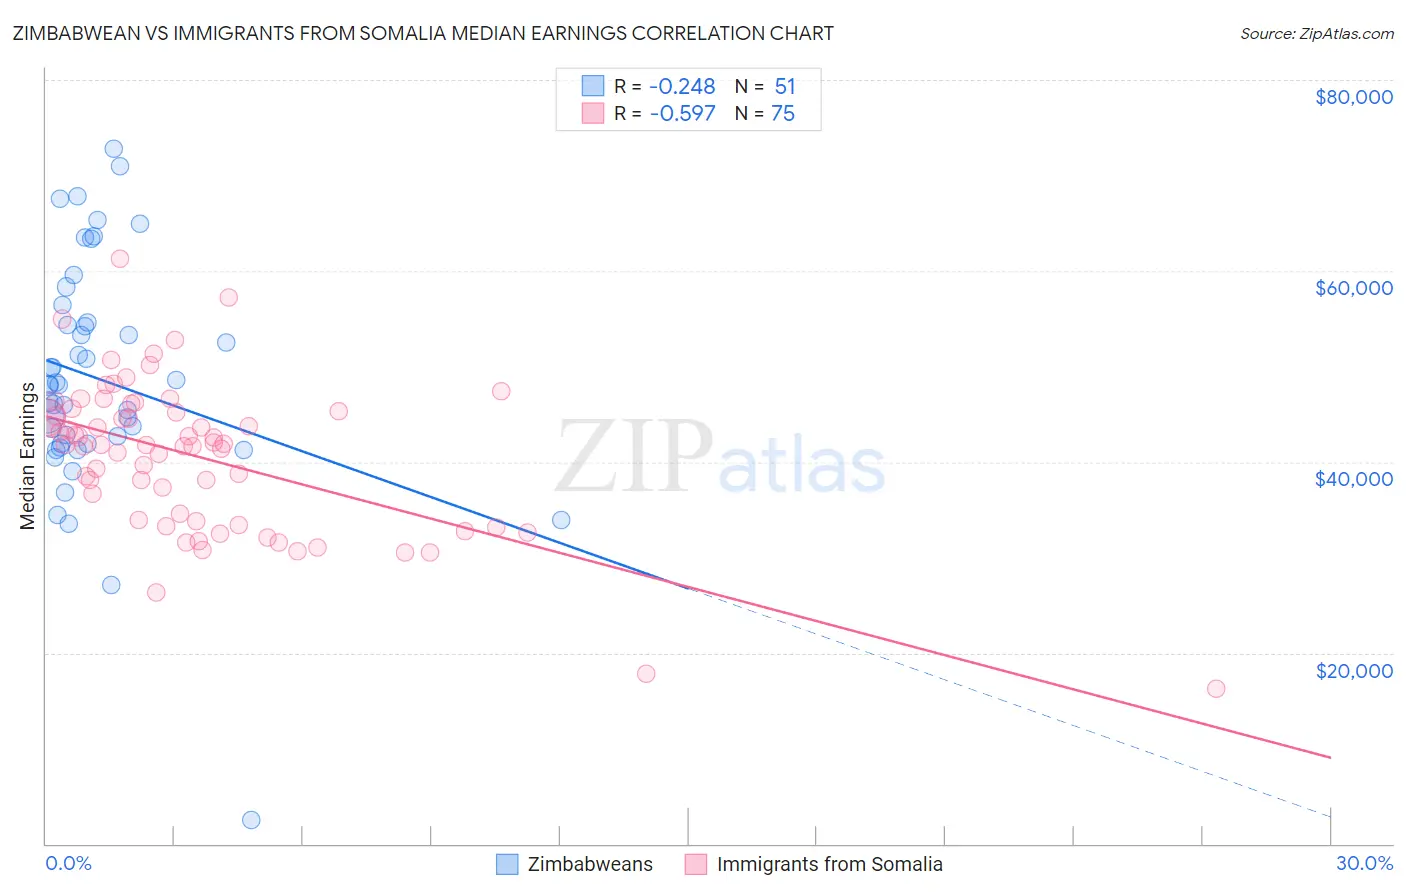
Zimbabwean vs Immigrants from Somalia Median Earnings Correlation Chart
The statistical analysis conducted on geographies consisting of 69,206,617 people shows a weak negative correlation between the proportion of Zimbabweans and median earnings in the United States with a correlation coefficient (R) of -0.248 and weighted average of $48,229. Similarly, the statistical analysis conducted on geographies consisting of 92,110,965 people shows a substantial negative correlation between the proportion of Immigrants from Somalia and median earnings in the United States with a correlation coefficient (R) of -0.597 and weighted average of $43,100, a difference of 11.9%.
Median Earnings Correlation Summary
| Measurement | Zimbabwean | Immigrants from Somalia |
| Minimum | $2,499 | $16,214 |
| Maximum | $72,836 | $61,239 |
| Range | $70,337 | $45,025 |
| Mean | $48,668 | $40,509 |
| Median | $48,062 | $41,780 |
| Interquartile 25% (IQ1) | $41,953 | $33,809 |
| Interquartile 75% (IQ3) | $54,537 | $45,326 |
| Interquartile Range (IQR) | $12,584 | $11,517 |
| Standard Deviation (Sample) | $12,230 | $7,944 |
| Standard Deviation (Population) | $12,110 | $7,891 |
Similar Demographics by Median Earnings
Demographics Similar to Zimbabweans by Median Earnings
In terms of median earnings, the demographic groups most similar to Zimbabweans are Lebanese ($48,226, a difference of 0.010%), Pakistani ($48,254, a difference of 0.050%), Immigrants from Philippines ($48,266, a difference of 0.080%), British ($48,189, a difference of 0.080%), and Sierra Leonean ($48,286, a difference of 0.12%).
| Demographics | Rating | Rank | Median Earnings |
| Immigrants | Syria | 93.9 /100 | #123 | Exceptional $48,375 |
| Brazilians | 93.7 /100 | #124 | Exceptional $48,356 |
| Immigrants | Fiji | 93.3 /100 | #125 | Exceptional $48,305 |
| Assyrians/Chaldeans/Syriacs | 93.3 /100 | #126 | Exceptional $48,304 |
| Sierra Leoneans | 93.1 /100 | #127 | Exceptional $48,286 |
| Immigrants | Philippines | 92.9 /100 | #128 | Exceptional $48,266 |
| Pakistanis | 92.8 /100 | #129 | Exceptional $48,254 |
| Zimbabweans | 92.6 /100 | #130 | Exceptional $48,229 |
| Lebanese | 92.5 /100 | #131 | Exceptional $48,226 |
| British | 92.2 /100 | #132 | Exceptional $48,189 |
| Immigrants | Uganda | 90.5 /100 | #133 | Exceptional $48,041 |
| Sri Lankans | 90.5 /100 | #134 | Exceptional $48,040 |
| Portuguese | 90.4 /100 | #135 | Exceptional $48,032 |
| Slovenes | 90.0 /100 | #136 | Excellent $47,995 |
| Immigrants | Nepal | 89.0 /100 | #137 | Excellent $47,925 |
Demographics Similar to Immigrants from Somalia by Median Earnings
In terms of median earnings, the demographic groups most similar to Immigrants from Somalia are Immigrants from Jamaica ($43,026, a difference of 0.17%), Nicaraguan ($43,026, a difference of 0.17%), German Russian ($43,200, a difference of 0.23%), Inupiat ($43,000, a difference of 0.23%), and Immigrants from Liberia ($42,923, a difference of 0.41%).
| Demographics | Rating | Rank | Median Earnings |
| Somalis | 1.8 /100 | #253 | Tragic $43,567 |
| Liberians | 1.7 /100 | #254 | Tragic $43,536 |
| Immigrants | Middle Africa | 1.4 /100 | #255 | Tragic $43,416 |
| Alaskan Athabascans | 1.4 /100 | #256 | Tragic $43,393 |
| Jamaicans | 1.3 /100 | #257 | Tragic $43,343 |
| French American Indians | 1.3 /100 | #258 | Tragic $43,333 |
| German Russians | 1.1 /100 | #259 | Tragic $43,200 |
| Immigrants | Somalia | 0.9 /100 | #260 | Tragic $43,100 |
| Immigrants | Jamaica | 0.8 /100 | #261 | Tragic $43,026 |
| Nicaraguans | 0.8 /100 | #262 | Tragic $43,026 |
| Inupiat | 0.8 /100 | #263 | Tragic $43,000 |
| Immigrants | Liberia | 0.7 /100 | #264 | Tragic $42,923 |
| Salvadorans | 0.7 /100 | #265 | Tragic $42,912 |
| Immigrants | Laos | 0.7 /100 | #266 | Tragic $42,884 |
| Cree | 0.6 /100 | #267 | Tragic $42,777 |