White/Caucasian vs Irish Householder Income Under 25 years
COMPARE
White/Caucasian
Irish
Householder Income Under 25 years
Householder Income Under 25 years Comparison
Whites/Caucasians
Irish
$50,336
HOUSEHOLDER INCOME UNDER 25 YEARS
1.1/ 100
METRIC RATING
258th/ 347
METRIC RANK
$51,317
HOUSEHOLDER INCOME UNDER 25 YEARS
10.6/ 100
METRIC RATING
211th/ 347
METRIC RANK
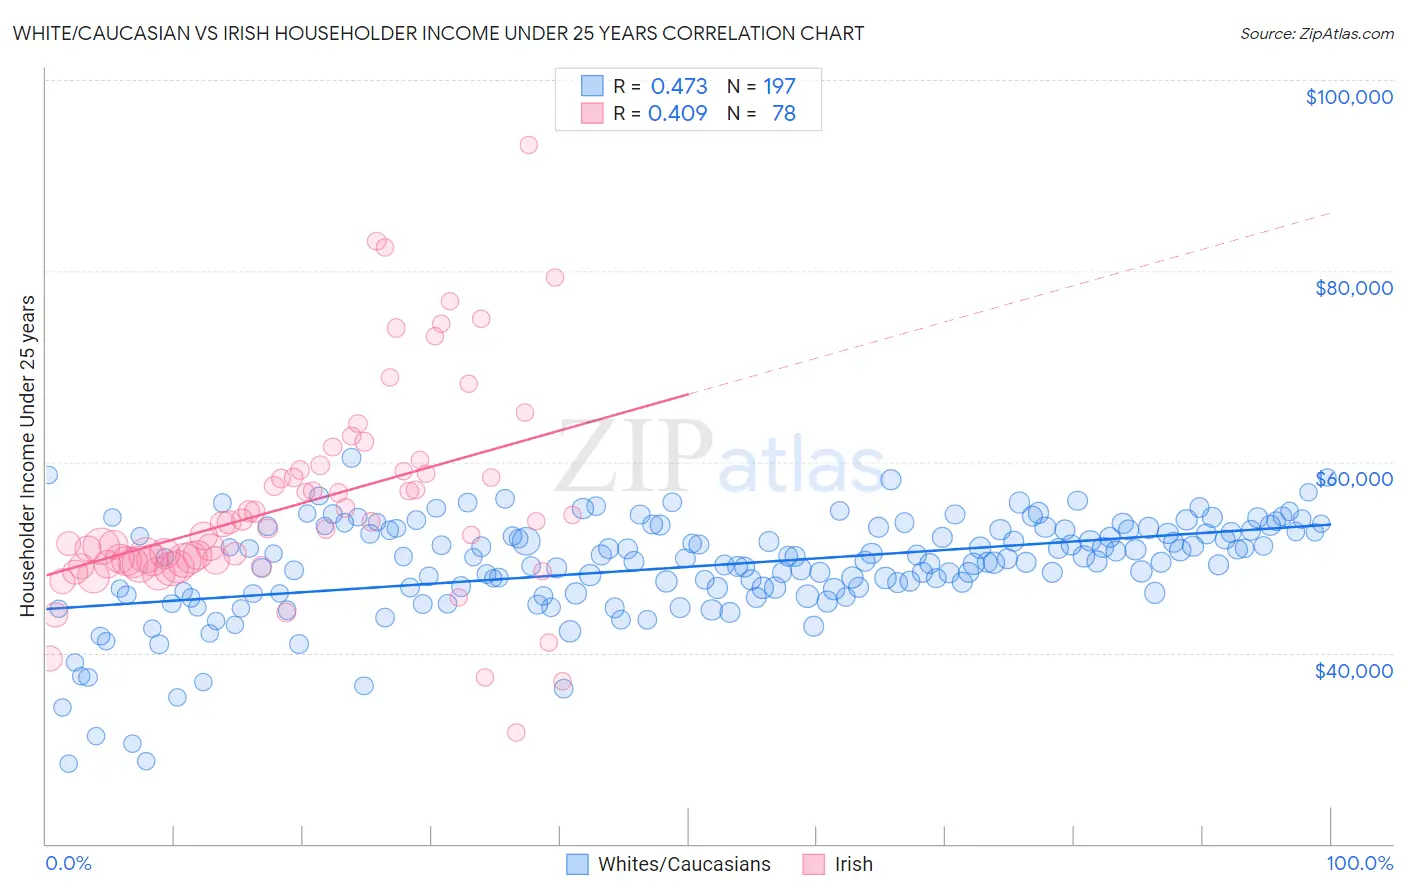
White/Caucasian vs Irish Householder Income Under 25 years Correlation Chart
The statistical analysis conducted on geographies consisting of 438,814,939 people shows a moderate positive correlation between the proportion of Whites/Caucasians and household income with householder under the age of 25 in the United States with a correlation coefficient (R) of 0.473 and weighted average of $50,336. Similarly, the statistical analysis conducted on geographies consisting of 440,822,070 people shows a moderate positive correlation between the proportion of Irish and household income with householder under the age of 25 in the United States with a correlation coefficient (R) of 0.409 and weighted average of $51,317, a difference of 1.9%.
Householder Income Under 25 years Correlation Summary
| Measurement | White/Caucasian | Irish |
| Minimum | $28,432 | $31,667 |
| Maximum | $60,456 | $93,226 |
| Range | $32,024 | $61,559 |
| Mean | $49,043 | $55,607 |
| Median | $49,887 | $53,275 |
| Interquartile 25% (IQ1) | $46,371 | $49,439 |
| Interquartile 75% (IQ3) | $52,865 | $58,969 |
| Interquartile Range (IQR) | $6,494 | $9,530 |
| Standard Deviation (Sample) | $5,415 | $10,889 |
| Standard Deviation (Population) | $5,401 | $10,819 |
Similar Demographics by Householder Income Under 25 years
Demographics Similar to Whites/Caucasians by Householder Income Under 25 years
In terms of householder income under 25 years, the demographic groups most similar to Whites/Caucasians are Lebanese ($50,355, a difference of 0.040%), Immigrants from Dominica ($50,301, a difference of 0.070%), Aleut ($50,377, a difference of 0.080%), Immigrants from Cuba ($50,374, a difference of 0.080%), and Luxembourger ($50,379, a difference of 0.090%).
| Demographics | Rating | Rank | Householder Income Under 25 years |
| Celtics | 1.4 /100 | #251 | Tragic $50,447 |
| Immigrants | Mexico | 1.3 /100 | #252 | Tragic $50,422 |
| Immigrants | Haiti | 1.2 /100 | #253 | Tragic $50,398 |
| Luxembourgers | 1.2 /100 | #254 | Tragic $50,379 |
| Aleuts | 1.2 /100 | #255 | Tragic $50,377 |
| Immigrants | Cuba | 1.2 /100 | #256 | Tragic $50,374 |
| Lebanese | 1.1 /100 | #257 | Tragic $50,355 |
| Whites/Caucasians | 1.1 /100 | #258 | Tragic $50,336 |
| Immigrants | Dominica | 1.0 /100 | #259 | Tragic $50,301 |
| Hispanics or Latinos | 0.9 /100 | #260 | Tragic $50,279 |
| Hungarians | 0.9 /100 | #261 | Tragic $50,247 |
| Haitians | 0.8 /100 | #262 | Tragic $50,231 |
| Immigrants | Dominican Republic | 0.8 /100 | #263 | Tragic $50,204 |
| Fijians | 0.6 /100 | #264 | Tragic $50,132 |
| Belgians | 0.6 /100 | #265 | Tragic $50,113 |
Demographics Similar to Irish by Householder Income Under 25 years
In terms of householder income under 25 years, the demographic groups most similar to Irish are Immigrants from Ghana ($51,333, a difference of 0.030%), Syrian ($51,353, a difference of 0.070%), Immigrants from Panama ($51,278, a difference of 0.080%), Immigrants from Jordan ($51,370, a difference of 0.10%), and Dutch ($51,265, a difference of 0.10%).
| Demographics | Rating | Rank | Householder Income Under 25 years |
| Czechs | 13.2 /100 | #204 | Poor $51,421 |
| Cape Verdeans | 12.3 /100 | #205 | Poor $51,387 |
| Immigrants | Latin America | 12.3 /100 | #206 | Poor $51,387 |
| South Africans | 12.2 /100 | #207 | Poor $51,383 |
| Immigrants | Jordan | 11.9 /100 | #208 | Poor $51,370 |
| Syrians | 11.4 /100 | #209 | Poor $51,353 |
| Immigrants | Ghana | 10.9 /100 | #210 | Poor $51,333 |
| Irish | 10.6 /100 | #211 | Poor $51,317 |
| Immigrants | Panama | 9.7 /100 | #212 | Tragic $51,278 |
| Dutch | 9.4 /100 | #213 | Tragic $51,265 |
| Zimbabweans | 9.3 /100 | #214 | Tragic $51,259 |
| Icelanders | 9.1 /100 | #215 | Tragic $51,247 |
| French | 8.7 /100 | #216 | Tragic $51,230 |
| Czechoslovakians | 8.6 /100 | #217 | Tragic $51,224 |
| Immigrants | Belize | 8.6 /100 | #218 | Tragic $51,223 |