White/Caucasian vs Australian Householder Income Under 25 years
COMPARE
White/Caucasian
Australian
Householder Income Under 25 years
Householder Income Under 25 years Comparison
Whites/Caucasians
Australians
$50,336
HOUSEHOLDER INCOME UNDER 25 YEARS
1.1/ 100
METRIC RATING
258th/ 347
METRIC RANK
$53,739
HOUSEHOLDER INCOME UNDER 25 YEARS
97.8/ 100
METRIC RATING
107th/ 347
METRIC RANK
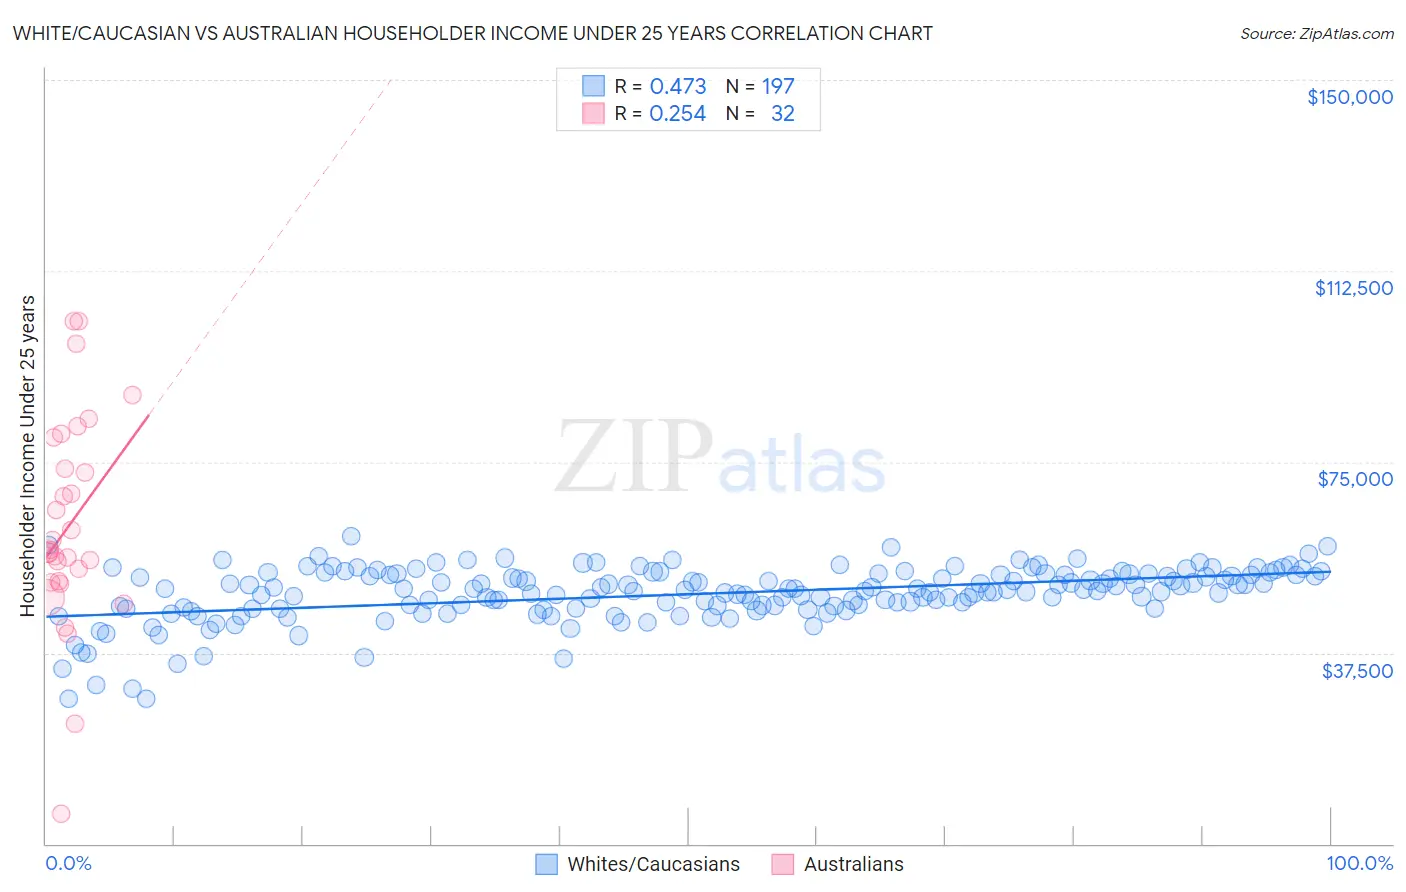
White/Caucasian vs Australian Householder Income Under 25 years Correlation Chart
The statistical analysis conducted on geographies consisting of 438,814,939 people shows a moderate positive correlation between the proportion of Whites/Caucasians and household income with householder under the age of 25 in the United States with a correlation coefficient (R) of 0.473 and weighted average of $50,336. Similarly, the statistical analysis conducted on geographies consisting of 200,158,480 people shows a weak positive correlation between the proportion of Australians and household income with householder under the age of 25 in the United States with a correlation coefficient (R) of 0.254 and weighted average of $53,739, a difference of 6.8%.
Householder Income Under 25 years Correlation Summary
| Measurement | White/Caucasian | Australian |
| Minimum | $28,432 | $6,009 |
| Maximum | $60,456 | $102,500 |
| Range | $32,024 | $96,491 |
| Mean | $49,043 | $62,514 |
| Median | $49,887 | $57,436 |
| Interquartile 25% (IQ1) | $46,371 | $51,485 |
| Interquartile 75% (IQ3) | $52,865 | $76,760 |
| Interquartile Range (IQR) | $6,494 | $25,275 |
| Standard Deviation (Sample) | $5,415 | $20,939 |
| Standard Deviation (Population) | $5,401 | $20,609 |
Similar Demographics by Householder Income Under 25 years
Demographics Similar to Whites/Caucasians by Householder Income Under 25 years
In terms of householder income under 25 years, the demographic groups most similar to Whites/Caucasians are Lebanese ($50,355, a difference of 0.040%), Immigrants from Dominica ($50,301, a difference of 0.070%), Aleut ($50,377, a difference of 0.080%), Immigrants from Cuba ($50,374, a difference of 0.080%), and Luxembourger ($50,379, a difference of 0.090%).
| Demographics | Rating | Rank | Householder Income Under 25 years |
| Celtics | 1.4 /100 | #251 | Tragic $50,447 |
| Immigrants | Mexico | 1.3 /100 | #252 | Tragic $50,422 |
| Immigrants | Haiti | 1.2 /100 | #253 | Tragic $50,398 |
| Luxembourgers | 1.2 /100 | #254 | Tragic $50,379 |
| Aleuts | 1.2 /100 | #255 | Tragic $50,377 |
| Immigrants | Cuba | 1.2 /100 | #256 | Tragic $50,374 |
| Lebanese | 1.1 /100 | #257 | Tragic $50,355 |
| Whites/Caucasians | 1.1 /100 | #258 | Tragic $50,336 |
| Immigrants | Dominica | 1.0 /100 | #259 | Tragic $50,301 |
| Hispanics or Latinos | 0.9 /100 | #260 | Tragic $50,279 |
| Hungarians | 0.9 /100 | #261 | Tragic $50,247 |
| Haitians | 0.8 /100 | #262 | Tragic $50,231 |
| Immigrants | Dominican Republic | 0.8 /100 | #263 | Tragic $50,204 |
| Fijians | 0.6 /100 | #264 | Tragic $50,132 |
| Belgians | 0.6 /100 | #265 | Tragic $50,113 |
Demographics Similar to Australians by Householder Income Under 25 years
In terms of householder income under 25 years, the demographic groups most similar to Australians are Maltese ($53,735, a difference of 0.010%), Immigrants from Ecuador ($53,722, a difference of 0.030%), Greek ($53,715, a difference of 0.040%), Immigrants from Colombia ($53,714, a difference of 0.050%), and Albanian ($53,794, a difference of 0.10%).
| Demographics | Rating | Rank | Householder Income Under 25 years |
| Immigrants | Kazakhstan | 98.8 /100 | #100 | Exceptional $53,990 |
| South Americans | 98.6 /100 | #101 | Exceptional $53,939 |
| Ecuadorians | 98.5 /100 | #102 | Exceptional $53,911 |
| Ukrainians | 98.3 /100 | #103 | Exceptional $53,843 |
| Ethiopians | 98.2 /100 | #104 | Exceptional $53,818 |
| Immigrants | France | 98.1 /100 | #105 | Exceptional $53,805 |
| Albanians | 98.1 /100 | #106 | Exceptional $53,794 |
| Australians | 97.8 /100 | #107 | Exceptional $53,739 |
| Maltese | 97.8 /100 | #108 | Exceptional $53,735 |
| Immigrants | Ecuador | 97.7 /100 | #109 | Exceptional $53,722 |
| Greeks | 97.7 /100 | #110 | Exceptional $53,715 |
| Immigrants | Colombia | 97.7 /100 | #111 | Exceptional $53,714 |
| Immigrants | Oceania | 97.5 /100 | #112 | Exceptional $53,680 |
| Romanians | 97.2 /100 | #113 | Exceptional $53,632 |
| Immigrants | Sweden | 97.1 /100 | #114 | Exceptional $53,621 |