White/Caucasian vs Yugoslavian Householder Income Under 25 years
COMPARE
White/Caucasian
Yugoslavian
Householder Income Under 25 years
Householder Income Under 25 years Comparison
Whites/Caucasians
Yugoslavians
$50,336
HOUSEHOLDER INCOME UNDER 25 YEARS
1.1/ 100
METRIC RATING
258th/ 347
METRIC RANK
$51,028
HOUSEHOLDER INCOME UNDER 25 YEARS
5.5/ 100
METRIC RATING
226th/ 347
METRIC RANK
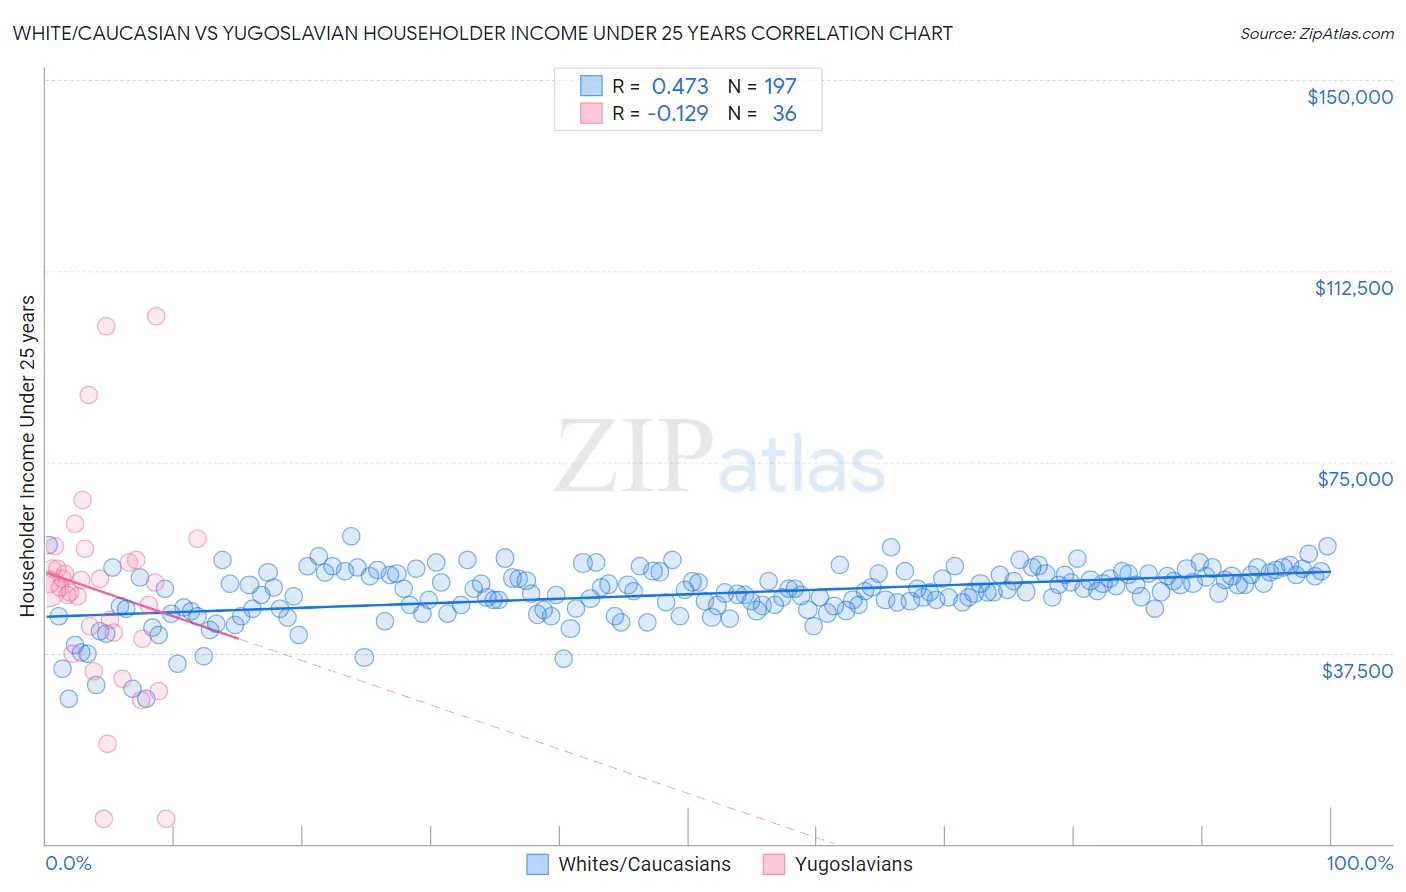
White/Caucasian vs Yugoslavian Householder Income Under 25 years Correlation Chart
The statistical analysis conducted on geographies consisting of 438,814,939 people shows a moderate positive correlation between the proportion of Whites/Caucasians and household income with householder under the age of 25 in the United States with a correlation coefficient (R) of 0.473 and weighted average of $50,336. Similarly, the statistical analysis conducted on geographies consisting of 250,106,142 people shows a poor negative correlation between the proportion of Yugoslavians and household income with householder under the age of 25 in the United States with a correlation coefficient (R) of -0.129 and weighted average of $51,028, a difference of 1.4%.
Householder Income Under 25 years Correlation Summary
| Measurement | White/Caucasian | Yugoslavian |
| Minimum | $28,432 | $4,881 |
| Maximum | $60,456 | $103,500 |
| Range | $32,024 | $98,619 |
| Mean | $49,043 | $49,574 |
| Median | $49,887 | $50,803 |
| Interquartile 25% (IQ1) | $46,371 | $40,912 |
| Interquartile 75% (IQ3) | $52,865 | $55,573 |
| Interquartile Range (IQR) | $6,494 | $14,662 |
| Standard Deviation (Sample) | $5,415 | $20,475 |
| Standard Deviation (Population) | $5,401 | $20,189 |
Similar Demographics by Householder Income Under 25 years
Demographics Similar to Whites/Caucasians by Householder Income Under 25 years
In terms of householder income under 25 years, the demographic groups most similar to Whites/Caucasians are Lebanese ($50,355, a difference of 0.040%), Immigrants from Dominica ($50,301, a difference of 0.070%), Aleut ($50,377, a difference of 0.080%), Immigrants from Cuba ($50,374, a difference of 0.080%), and Luxembourger ($50,379, a difference of 0.090%).
| Demographics | Rating | Rank | Householder Income Under 25 years |
| Celtics | 1.4 /100 | #251 | Tragic $50,447 |
| Immigrants | Mexico | 1.3 /100 | #252 | Tragic $50,422 |
| Immigrants | Haiti | 1.2 /100 | #253 | Tragic $50,398 |
| Luxembourgers | 1.2 /100 | #254 | Tragic $50,379 |
| Aleuts | 1.2 /100 | #255 | Tragic $50,377 |
| Immigrants | Cuba | 1.2 /100 | #256 | Tragic $50,374 |
| Lebanese | 1.1 /100 | #257 | Tragic $50,355 |
| Whites/Caucasians | 1.1 /100 | #258 | Tragic $50,336 |
| Immigrants | Dominica | 1.0 /100 | #259 | Tragic $50,301 |
| Hispanics or Latinos | 0.9 /100 | #260 | Tragic $50,279 |
| Hungarians | 0.9 /100 | #261 | Tragic $50,247 |
| Haitians | 0.8 /100 | #262 | Tragic $50,231 |
| Immigrants | Dominican Republic | 0.8 /100 | #263 | Tragic $50,204 |
| Fijians | 0.6 /100 | #264 | Tragic $50,132 |
| Belgians | 0.6 /100 | #265 | Tragic $50,113 |
Demographics Similar to Yugoslavians by Householder Income Under 25 years
In terms of householder income under 25 years, the demographic groups most similar to Yugoslavians are Immigrants from Central America ($51,022, a difference of 0.010%), Immigrants from Jamaica ($51,038, a difference of 0.020%), Immigrants from Norway ($50,984, a difference of 0.090%), Belizean ($51,094, a difference of 0.13%), and Serbian ($51,106, a difference of 0.15%).
| Demographics | Rating | Rank | Householder Income Under 25 years |
| Arabs | 8.5 /100 | #219 | Tragic $51,219 |
| Immigrants | Germany | 8.0 /100 | #220 | Tragic $51,190 |
| Immigrants | Eastern Africa | 7.4 /100 | #221 | Tragic $51,158 |
| Spaniards | 6.8 /100 | #222 | Tragic $51,117 |
| Serbians | 6.6 /100 | #223 | Tragic $51,106 |
| Belizeans | 6.4 /100 | #224 | Tragic $51,094 |
| Immigrants | Jamaica | 5.6 /100 | #225 | Tragic $51,038 |
| Yugoslavians | 5.5 /100 | #226 | Tragic $51,028 |
| Immigrants | Central America | 5.4 /100 | #227 | Tragic $51,022 |
| Immigrants | Norway | 5.0 /100 | #228 | Tragic $50,984 |
| Yuman | 4.4 /100 | #229 | Tragic $50,933 |
| Jamaicans | 4.4 /100 | #230 | Tragic $50,929 |
| Ugandans | 4.3 /100 | #231 | Tragic $50,923 |
| Slovenes | 4.0 /100 | #232 | Tragic $50,886 |
| Pennsylvania Germans | 3.7 /100 | #233 | Tragic $50,852 |