White/Caucasian vs Paraguayan Householder Income Under 25 years
COMPARE
White/Caucasian
Paraguayan
Householder Income Under 25 years
Householder Income Under 25 years Comparison
Whites/Caucasians
Paraguayans
$50,336
HOUSEHOLDER INCOME UNDER 25 YEARS
1.1/ 100
METRIC RATING
258th/ 347
METRIC RANK
$55,614
HOUSEHOLDER INCOME UNDER 25 YEARS
100.0/ 100
METRIC RATING
44th/ 347
METRIC RANK
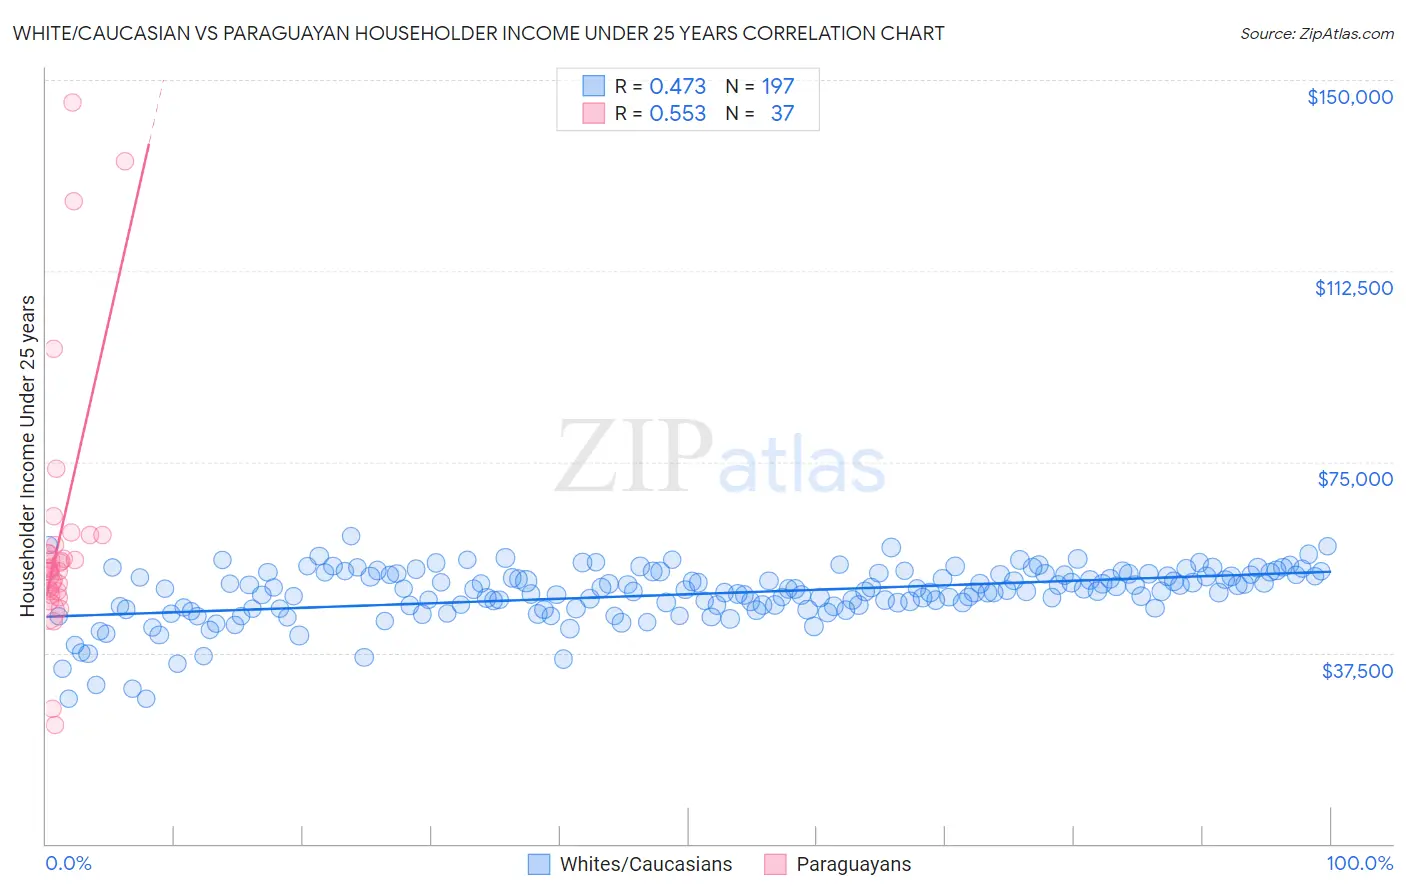
White/Caucasian vs Paraguayan Householder Income Under 25 years Correlation Chart
The statistical analysis conducted on geographies consisting of 438,814,939 people shows a moderate positive correlation between the proportion of Whites/Caucasians and household income with householder under the age of 25 in the United States with a correlation coefficient (R) of 0.473 and weighted average of $50,336. Similarly, the statistical analysis conducted on geographies consisting of 88,924,769 people shows a substantial positive correlation between the proportion of Paraguayans and household income with householder under the age of 25 in the United States with a correlation coefficient (R) of 0.553 and weighted average of $55,614, a difference of 10.5%.
Householder Income Under 25 years Correlation Summary
| Measurement | White/Caucasian | Paraguayan |
| Minimum | $28,432 | $23,438 |
| Maximum | $60,456 | $145,536 |
| Range | $32,024 | $122,098 |
| Mean | $49,043 | $60,245 |
| Median | $49,887 | $54,059 |
| Interquartile 25% (IQ1) | $46,371 | $49,601 |
| Interquartile 75% (IQ3) | $52,865 | $59,594 |
| Interquartile Range (IQR) | $6,494 | $9,992 |
| Standard Deviation (Sample) | $5,415 | $25,388 |
| Standard Deviation (Population) | $5,401 | $25,042 |
Similar Demographics by Householder Income Under 25 years
Demographics Similar to Whites/Caucasians by Householder Income Under 25 years
In terms of householder income under 25 years, the demographic groups most similar to Whites/Caucasians are Lebanese ($50,355, a difference of 0.040%), Immigrants from Dominica ($50,301, a difference of 0.070%), Aleut ($50,377, a difference of 0.080%), Immigrants from Cuba ($50,374, a difference of 0.080%), and Luxembourger ($50,379, a difference of 0.090%).
| Demographics | Rating | Rank | Householder Income Under 25 years |
| Celtics | 1.4 /100 | #251 | Tragic $50,447 |
| Immigrants | Mexico | 1.3 /100 | #252 | Tragic $50,422 |
| Immigrants | Haiti | 1.2 /100 | #253 | Tragic $50,398 |
| Luxembourgers | 1.2 /100 | #254 | Tragic $50,379 |
| Aleuts | 1.2 /100 | #255 | Tragic $50,377 |
| Immigrants | Cuba | 1.2 /100 | #256 | Tragic $50,374 |
| Lebanese | 1.1 /100 | #257 | Tragic $50,355 |
| Whites/Caucasians | 1.1 /100 | #258 | Tragic $50,336 |
| Immigrants | Dominica | 1.0 /100 | #259 | Tragic $50,301 |
| Hispanics or Latinos | 0.9 /100 | #260 | Tragic $50,279 |
| Hungarians | 0.9 /100 | #261 | Tragic $50,247 |
| Haitians | 0.8 /100 | #262 | Tragic $50,231 |
| Immigrants | Dominican Republic | 0.8 /100 | #263 | Tragic $50,204 |
| Fijians | 0.6 /100 | #264 | Tragic $50,132 |
| Belgians | 0.6 /100 | #265 | Tragic $50,113 |
Demographics Similar to Paraguayans by Householder Income Under 25 years
In terms of householder income under 25 years, the demographic groups most similar to Paraguayans are Spanish American Indian ($55,573, a difference of 0.070%), Immigrants from Eastern Europe ($55,572, a difference of 0.070%), Cambodian ($55,571, a difference of 0.080%), Immigrants from Vietnam ($55,562, a difference of 0.090%), and Iranian ($55,548, a difference of 0.12%).
| Demographics | Rating | Rank | Householder Income Under 25 years |
| Immigrants | Russia | 100.0 /100 | #37 | Exceptional $55,891 |
| Immigrants | Iran | 100.0 /100 | #38 | Exceptional $55,880 |
| Immigrants | Belarus | 100.0 /100 | #39 | Exceptional $55,743 |
| Immigrants | Greece | 100.0 /100 | #40 | Exceptional $55,727 |
| Immigrants | Guyana | 100.0 /100 | #41 | Exceptional $55,726 |
| Immigrants | Korea | 100.0 /100 | #42 | Exceptional $55,716 |
| Immigrants | South Eastern Asia | 100.0 /100 | #43 | Exceptional $55,714 |
| Paraguayans | 100.0 /100 | #44 | Exceptional $55,614 |
| Spanish American Indians | 100.0 /100 | #45 | Exceptional $55,573 |
| Immigrants | Eastern Europe | 100.0 /100 | #46 | Exceptional $55,572 |
| Cambodians | 100.0 /100 | #47 | Exceptional $55,571 |
| Immigrants | Vietnam | 100.0 /100 | #48 | Exceptional $55,562 |
| Iranians | 100.0 /100 | #49 | Exceptional $55,548 |
| Puget Sound Salish | 100.0 /100 | #50 | Exceptional $55,543 |
| Immigrants | Romania | 100.0 /100 | #51 | Exceptional $55,522 |