Immigrants from Italy vs Irish Householder Income Under 25 years

COMPARE

Immigrants from Italy
Race
Ancestry
AfghanAfricanAlaska NativeAlaskan AthabascanAlbanianAleutAlsatianAmericanApacheArabArapahoArgentineanArmenianAssyrian/Chaldean/SyriacAustralianAustrianBahamianBangladeshiBarbadianBasqueBelgianBelizeanBermudanBhutaneseBlackfeetBolivianBrazilianBritishBritish West IndianBulgarianBurmeseCajunCambodianCanadianCape VerdeanCarpatho RusynCelticCentral AmericanCentral American IndianCherokeeCheyenneChickasawChileanChineseChippewaChoctawColombianColvilleComancheCosta RicanCreeCreekCroatianCrowCubanCypriotCzechCzechoslovakianDanishDelawareDominicanDutchDutch West IndianEastern EuropeanEcuadorianEgyptianEnglishEstonianEthiopianEuropeanFijianFilipinoFinnishFrenchFrench American IndianFrench CanadianGermanGerman RussianGhanaianGreekGuamanian/ChamorroGuatemalanGuyaneseHaitianHmongHonduranHopiHoumaHungarianIcelanderIndian (Asian)IndonesianInupiatIranianIraqiIroquoisIsraeliItalianJamaicanJapaneseJordanianKenyanKiowaKoreanLaotianLatvianLebaneseLiberianLithuanianLumbeeLuxembourgerMacedonianMalaysianMalteseMarshalleseMenomineeMexicanMexican American IndianMongolianMoroccanNative HawaiianNavajoNepaleseNew ZealanderNicaraguanNigerianNorthern EuropeanNorwegianOkinawanOsageOttawaPaiutePakistaniPalestinianPanamanianParaguayanPennsylvania GermanPeruvianPimaPolishPortuguesePotawatomiPuebloPuerto RicanPuget Sound SalishRomanianRussianSalvadoranSamoanScandinavianScotch-IrishScottishSeminoleSenegaleseSerbianShoshoneSierra LeoneanSiouxSlavicSlovakSloveneSomaliSouth AfricanSouth AmericanSouth American IndianSoviet UnionSpaniardSpanishSpanish AmericanSpanish American IndianSri LankanSubsaharan AfricanSudaneseSwedishSwissSyrianTaiwaneseThaiTlingit-HaidaTohono O'OdhamTonganTrinidadian and TobagonianTsimshianTurkishU.S. Virgin IslanderUgandanUkrainianUruguayanUteVenezuelanVietnameseWelshWest IndianYakamaYaquiYugoslavianYumanYup'ikZimbabwean
Immigration
NonimmigrantsImmigrantsAfghanistanAfricaAlbaniaArgentinaArmeniaAsiaAustraliaAustriaBahamasBangladeshBarbadosBelarusBelgiumBelizeBoliviaBosnia and HerzegovinaBrazilBulgariaBurma/MyanmarCabo VerdeCambodiaCameroonCanadaCaribbeanCentral AmericaChileChinaColombiaCongoCosta RicaCroatiaCubaCzechoslovakiaDenmarkDominicaDominican RepublicEastern AfricaEastern AsiaEastern EuropeEcuadorEgyptEl SalvadorEnglandEritreaEthiopiaEuropeFijiFranceGermanyGhanaGreeceGrenadaGuatemalaGuyanaHaitiHondurasHong KongHungaryIndiaIndonesiaIranIraqIrelandIsraelItalyJamaicaJapanJordanKazakhstanKenyaKoreaKuwaitLaosLatin AmericaLatviaLebanonLiberiaLithuaniaMalaysiaMexicoMicronesiaMiddle AfricaMoldovaMoroccoNepalNetherlandsNicaraguaNigeriaNorth AmericaNorth MacedoniaNorthern AfricaNorthern EuropeNorwayOceaniaPakistanPanamaPeruPhilippinesPolandPortugalRomaniaRussiaSaudi ArabiaScotlandSenegalSerbiaSierra LeoneSingaporeSomaliaSouth AfricaSouth AmericaSouth Central AsiaSouth Eastern AsiaSouthern EuropeSpainSri LankaSt. Vincent and the GrenadinesSudanSwedenSwitzerlandSyriaTaiwanThailandTrinidad and TobagoTurkeyUgandaUkraineUruguayUzbekistanVenezuelaVietnamWest IndiesWestern AfricaWestern AsiaWestern EuropeYemenZaireZimbabweAzores
Irish
Race
Ancestry
AfghanAfricanAlaska NativeAlaskan AthabascanAlbanianAleutAlsatianAmericanApacheArabArapahoArgentineanArmenianAssyrian/Chaldean/SyriacAustralianAustrianBahamianBangladeshiBarbadianBasqueBelgianBelizeanBermudanBhutaneseBlackfeetBolivianBrazilianBritishBritish West IndianBulgarianBurmeseCajunCambodianCanadianCape VerdeanCarpatho RusynCelticCentral AmericanCentral American IndianCherokeeCheyenneChickasawChileanChineseChippewaChoctawColombianColvilleComancheCosta RicanCreeCreekCroatianCrowCubanCypriotCzechCzechoslovakianDanishDelawareDominicanDutchDutch West IndianEastern EuropeanEcuadorianEgyptianEnglishEstonianEthiopianEuropeanFijianFilipinoFinnishFrenchFrench American IndianFrench CanadianGermanGerman RussianGhanaianGreekGuamanian/ChamorroGuatemalanGuyaneseHaitianHmongHonduranHopiHoumaHungarianIcelanderIndian (Asian)IndonesianInupiatIranianIraqiIrishIroquoisIsraeliItalianJamaicanJapaneseJordanianKenyanKiowaKoreanLaotianLatvianLebaneseLiberianLithuanianLumbeeLuxembourgerMacedonianMalaysianMalteseMarshalleseMenomineeMexicanMexican American IndianMongolianMoroccanNative HawaiianNavajoNepaleseNew ZealanderNicaraguanNigerianNorthern EuropeanNorwegianOkinawanOsageOttawaPaiutePakistaniPalestinianPanamanianParaguayanPennsylvania GermanPeruvianPimaPolishPortuguesePotawatomiPuebloPuerto RicanPuget Sound SalishRomanianRussianSalvadoranSamoanScandinavianScotch-IrishScottishSeminoleSenegaleseSerbianShoshoneSierra LeoneanSiouxSlavicSlovakSloveneSomaliSouth AfricanSouth AmericanSouth American IndianSoviet UnionSpaniardSpanishSpanish AmericanSpanish American IndianSri LankanSubsaharan AfricanSudaneseSwedishSwissSyrianTaiwaneseThaiTlingit-HaidaTohono O'OdhamTonganTrinidadian and TobagonianTsimshianTurkishU.S. Virgin IslanderUgandanUkrainianUruguayanUteVenezuelanVietnameseWelshWest IndianYakamaYaquiYugoslavianYumanYup'ikZimbabwean
Immigration
NonimmigrantsImmigrantsAfghanistanAfricaAlbaniaArgentinaArmeniaAsiaAustraliaAustriaBahamasBangladeshBarbadosBelarusBelgiumBelizeBoliviaBosnia and HerzegovinaBrazilBulgariaBurma/MyanmarCabo VerdeCambodiaCameroonCanadaCaribbeanCentral AmericaChileChinaColombiaCongoCosta RicaCroatiaCubaCzechoslovakiaDenmarkDominicaDominican RepublicEastern AfricaEastern AsiaEastern EuropeEcuadorEgyptEl SalvadorEnglandEritreaEthiopiaEuropeFijiFranceGermanyGhanaGreeceGrenadaGuatemalaGuyanaHaitiHondurasHong KongHungaryIndiaIndonesiaIranIraqIrelandIsraelJamaicaJapanJordanKazakhstanKenyaKoreaKuwaitLaosLatin AmericaLatviaLebanonLiberiaLithuaniaMalaysiaMexicoMicronesiaMiddle AfricaMoldovaMoroccoNepalNetherlandsNicaraguaNigeriaNorth AmericaNorth MacedoniaNorthern AfricaNorthern EuropeNorwayOceaniaPakistanPanamaPeruPhilippinesPolandPortugalRomaniaRussiaSaudi ArabiaScotlandSenegalSerbiaSierra LeoneSingaporeSomaliaSouth AfricaSouth AmericaSouth Central AsiaSouth Eastern AsiaSouthern EuropeSpainSri LankaSt. Vincent and the GrenadinesSudanSwedenSwitzerlandSyriaTaiwanThailandTrinidad and TobagoTurkeyUgandaUkraineUruguayUzbekistanVenezuelaVietnamWest IndiesWestern AfricaWestern AsiaWestern EuropeYemenZaireZimbabweAzores
Householder Income Under 25 years
Income
Poverty
Unemployment
Labor Participation
Family Structure
Vehicle Availability
Education Level
Disability

Householder Income Under 25 years Comparison

Immigrants from Italy

Irish

Exceptional
Poor
$54,449
HOUSEHOLDER INCOME UNDER 25 YEARS
99.6/ 100
METRIC RATING
79th/ 347
METRIC RANK
$51,317
HOUSEHOLDER INCOME UNDER 25 YEARS
10.6/ 100
METRIC RATING
211th/ 347
METRIC RANK

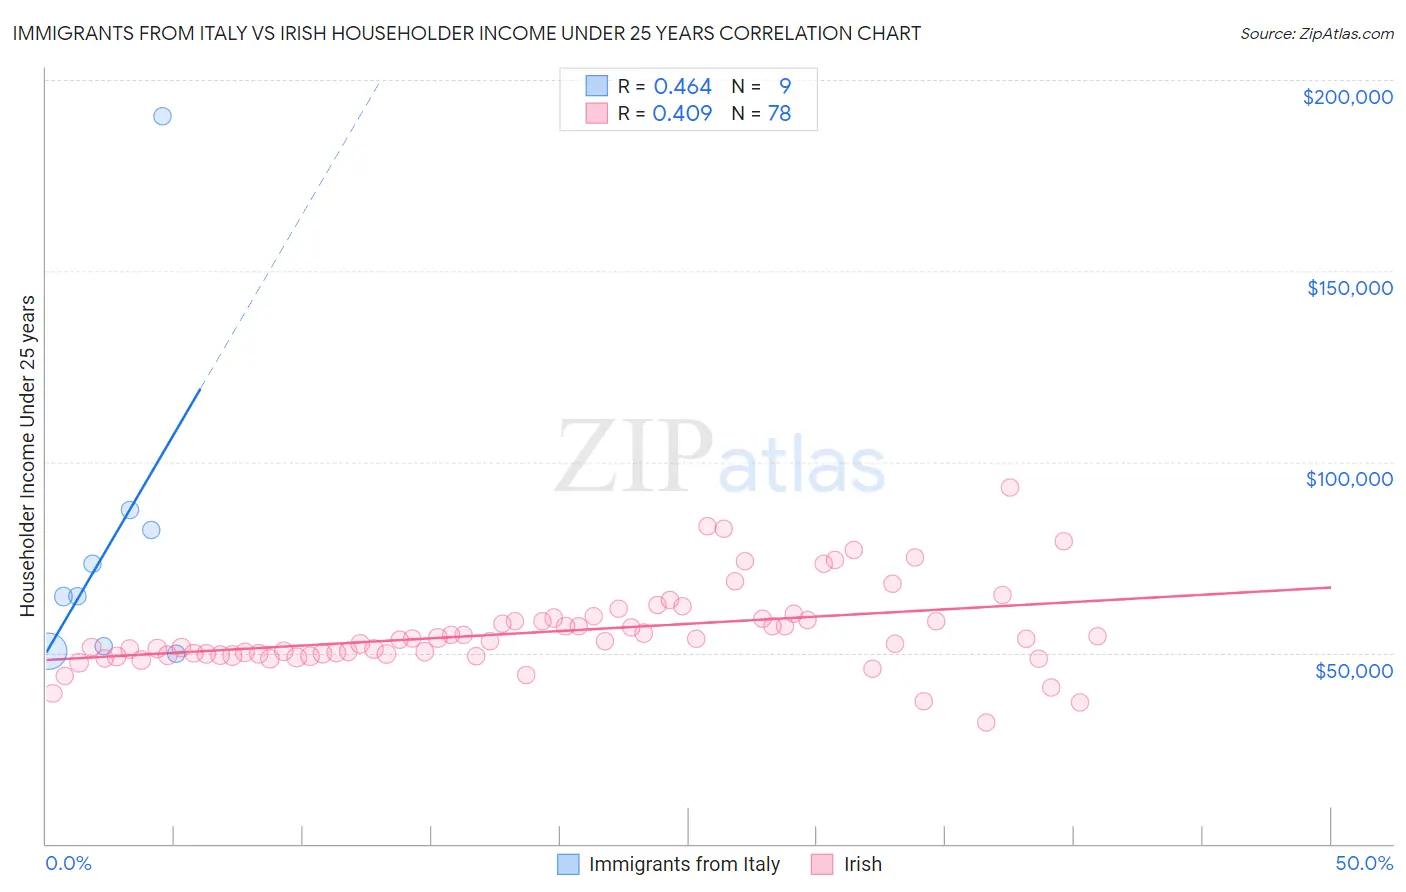
Immigrants from Italy vs Irish Householder Income Under 25 years Correlation Chart

The statistical analysis conducted on geographies consisting of 270,047,838 people shows a moderate positive correlation between the proportion of Immigrants from Italy and household income with householder under the age of 25 in the United States with a correlation coefficient (R) of 0.464 and weighted average of $54,449. Similarly, the statistical analysis conducted on geographies consisting of 440,822,070 people shows a moderate positive correlation between the proportion of Irish and household income with householder under the age of 25 in the United States with a correlation coefficient (R) of 0.409 and weighted average of $51,317, a difference of 6.1%.
Immigrants from Italy vs Irish Householder Income Under 25 years

Householder Income Under 25 years Correlation Summary

MeasurementImmigrants from ItalyIrish
Minimum$49,766$31,667
Maximum$190,500$93,226
Range$140,734$61,559
Mean$79,409$55,607
Median$64,734$53,275
Interquartile 25% (IQ1)$51,078$49,439
Interquartile 75% (IQ3)$84,764$58,969
Interquartile Range (IQR)$33,686$9,530
Standard Deviation (Sample)$43,825$10,889
Standard Deviation (Population)$41,318$10,819

Similar Demographics by Householder Income Under 25 years

Demographics Similar to Immigrants from Italy by Householder Income Under 25 years

In terms of householder income under 25 years, the demographic groups most similar to Immigrants from Italy are Egyptian ($54,444, a difference of 0.010%), Portuguese ($54,436, a difference of 0.020%), Nepalese ($54,472, a difference of 0.040%), Immigrants from Southern Europe ($54,484, a difference of 0.060%), and Immigrants from Brazil ($54,487, a difference of 0.070%).
DemographicsRating | RankHouseholder Income Under 25 years
Immigrants | Northern Europe
99.7
/100
|
#72
Exceptional
$54,571
Macedonians
99.7
/100
|
#73
Exceptional
$54,563
Immigrants | Grenada
99.7
/100
|
#74
Exceptional
$54,538
Immigrants | Sri Lanka
99.7
/100
|
#75
Exceptional
$54,512
Immigrants | Brazil
99.6
/100
|
#76
Exceptional
$54,487
Immigrants | Southern Europe
99.6
/100
|
#77
Exceptional
$54,484
Nepalese
99.6
/100
|
#78
Exceptional
$54,472
Immigrants | Italy
99.6
/100
|
#79
Exceptional
$54,449
Egyptians
99.6
/100
|
#80
Exceptional
$54,444
Portuguese
99.6
/100
|
#81
Exceptional
$54,436
Russians
99.5
/100
|
#82
Exceptional
$54,389
Laotians
99.5
/100
|
#83
Exceptional
$54,369
Bulgarians
99.5
/100
|
#84
Exceptional
$54,352
Immigrants | Czechoslovakia
99.5
/100
|
#85
Exceptional
$54,352
Immigrants | Croatia
99.5
/100
|
#86
Exceptional
$54,343

Demographics Similar to Irish by Householder Income Under 25 years

In terms of householder income under 25 years, the demographic groups most similar to Irish are Immigrants from Ghana ($51,333, a difference of 0.030%), Syrian ($51,353, a difference of 0.070%), Immigrants from Panama ($51,278, a difference of 0.080%), Immigrants from Jordan ($51,370, a difference of 0.10%), and Dutch ($51,265, a difference of 0.10%).
DemographicsRating | RankHouseholder Income Under 25 years
Czechs
13.2
/100
|
#204
Poor
$51,421
Cape Verdeans
12.3
/100
|
#205
Poor
$51,387
Immigrants | Latin America
12.3
/100
|
#206
Poor
$51,387
South Africans
12.2
/100
|
#207
Poor
$51,383
Immigrants | Jordan
11.9
/100
|
#208
Poor
$51,370
Syrians
11.4
/100
|
#209
Poor
$51,353
Immigrants | Ghana
10.9
/100
|
#210
Poor
$51,333
Irish
10.6
/100
|
#211
Poor
$51,317
Immigrants | Panama
9.7
/100
|
#212
Tragic
$51,278
Dutch
9.4
/100
|
#213
Tragic
$51,265
Zimbabweans
9.3
/100
|
#214
Tragic
$51,259
Icelanders
9.1
/100
|
#215
Tragic
$51,247
French
8.7
/100
|
#216
Tragic
$51,230
Czechoslovakians
8.6
/100
|
#217
Tragic
$51,224
Immigrants | Belize
8.6
/100
|
#218
Tragic
$51,223