White/Caucasian vs Paiute Householder Income Under 25 years
COMPARE
White/Caucasian
Paiute
Householder Income Under 25 years
Householder Income Under 25 years Comparison
Whites/Caucasians
Paiute
$50,336
HOUSEHOLDER INCOME UNDER 25 YEARS
1.1/ 100
METRIC RATING
258th/ 347
METRIC RANK
$51,743
HOUSEHOLDER INCOME UNDER 25 YEARS
25.1/ 100
METRIC RATING
184th/ 347
METRIC RANK
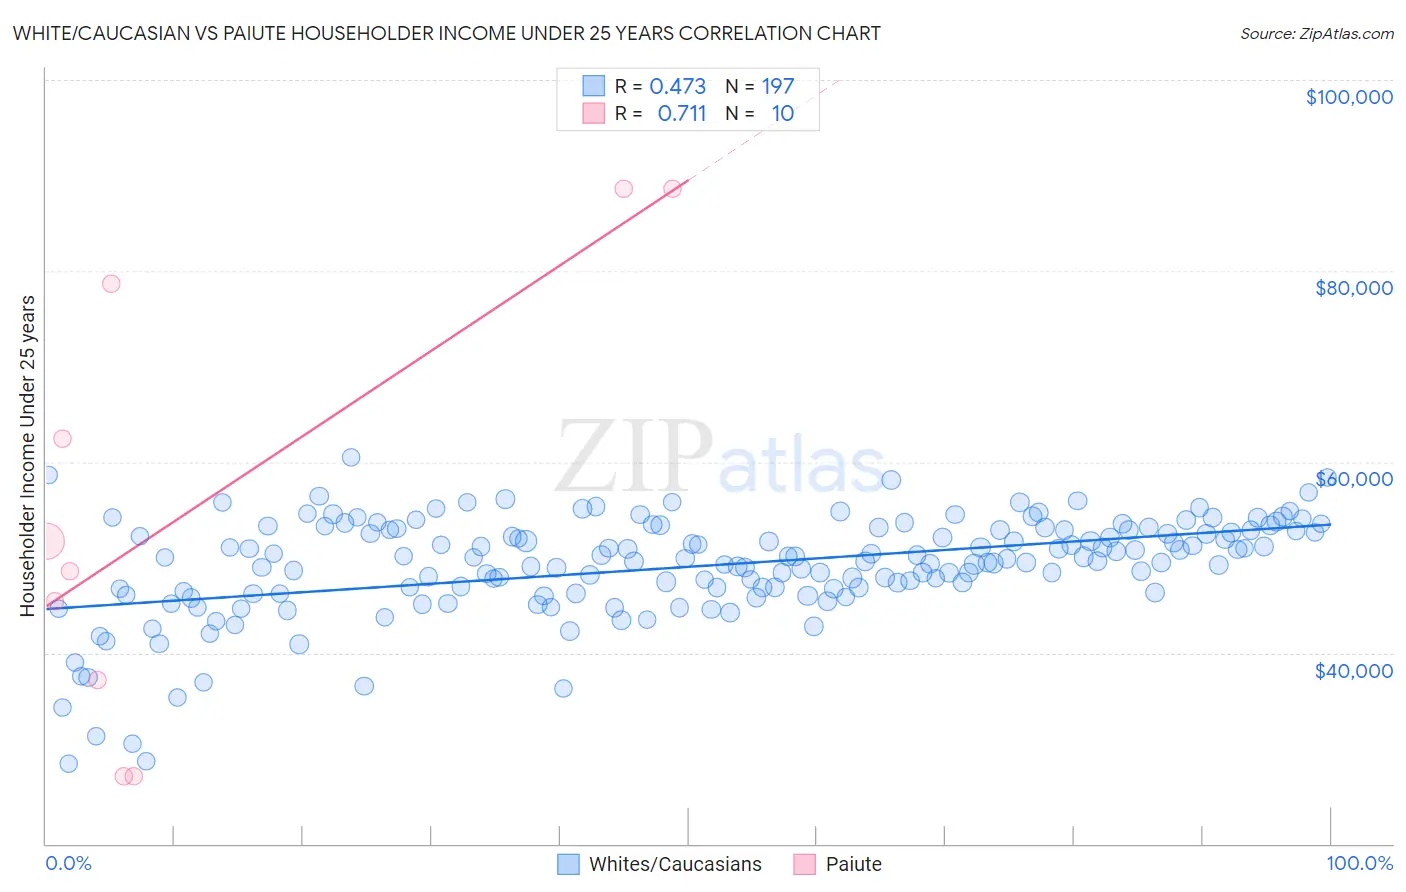
White/Caucasian vs Paiute Householder Income Under 25 years Correlation Chart
The statistical analysis conducted on geographies consisting of 438,814,939 people shows a moderate positive correlation between the proportion of Whites/Caucasians and household income with householder under the age of 25 in the United States with a correlation coefficient (R) of 0.473 and weighted average of $50,336. Similarly, the statistical analysis conducted on geographies consisting of 55,798,660 people shows a strong positive correlation between the proportion of Paiute and household income with householder under the age of 25 in the United States with a correlation coefficient (R) of 0.711 and weighted average of $51,743, a difference of 2.8%.
Householder Income Under 25 years Correlation Summary
| Measurement | White/Caucasian | Paiute |
| Minimum | $28,432 | $27,120 |
| Maximum | $60,456 | $88,654 |
| Range | $32,024 | $61,534 |
| Mean | $49,043 | $55,543 |
| Median | $49,887 | $50,117 |
| Interquartile 25% (IQ1) | $46,371 | $37,118 |
| Interquartile 75% (IQ3) | $52,865 | $78,623 |
| Interquartile Range (IQR) | $6,494 | $41,505 |
| Standard Deviation (Sample) | $5,415 | $23,320 |
| Standard Deviation (Population) | $5,401 | $22,123 |
Similar Demographics by Householder Income Under 25 years
Demographics Similar to Whites/Caucasians by Householder Income Under 25 years
In terms of householder income under 25 years, the demographic groups most similar to Whites/Caucasians are Lebanese ($50,355, a difference of 0.040%), Immigrants from Dominica ($50,301, a difference of 0.070%), Aleut ($50,377, a difference of 0.080%), Immigrants from Cuba ($50,374, a difference of 0.080%), and Luxembourger ($50,379, a difference of 0.090%).
| Demographics | Rating | Rank | Householder Income Under 25 years |
| Celtics | 1.4 /100 | #251 | Tragic $50,447 |
| Immigrants | Mexico | 1.3 /100 | #252 | Tragic $50,422 |
| Immigrants | Haiti | 1.2 /100 | #253 | Tragic $50,398 |
| Luxembourgers | 1.2 /100 | #254 | Tragic $50,379 |
| Aleuts | 1.2 /100 | #255 | Tragic $50,377 |
| Immigrants | Cuba | 1.2 /100 | #256 | Tragic $50,374 |
| Lebanese | 1.1 /100 | #257 | Tragic $50,355 |
| Whites/Caucasians | 1.1 /100 | #258 | Tragic $50,336 |
| Immigrants | Dominica | 1.0 /100 | #259 | Tragic $50,301 |
| Hispanics or Latinos | 0.9 /100 | #260 | Tragic $50,279 |
| Hungarians | 0.9 /100 | #261 | Tragic $50,247 |
| Haitians | 0.8 /100 | #262 | Tragic $50,231 |
| Immigrants | Dominican Republic | 0.8 /100 | #263 | Tragic $50,204 |
| Fijians | 0.6 /100 | #264 | Tragic $50,132 |
| Belgians | 0.6 /100 | #265 | Tragic $50,113 |
Demographics Similar to Paiute by Householder Income Under 25 years
In terms of householder income under 25 years, the demographic groups most similar to Paiute are Immigrants from Latvia ($51,737, a difference of 0.010%), Alaskan Athabascan ($51,713, a difference of 0.060%), Immigrants from South Africa ($51,705, a difference of 0.070%), Mexican American Indian ($51,783, a difference of 0.080%), and European ($51,796, a difference of 0.10%).
| Demographics | Rating | Rank | Householder Income Under 25 years |
| British West Indians | 30.0 /100 | #177 | Fair $51,844 |
| Finns | 29.2 /100 | #178 | Fair $51,827 |
| Basques | 28.7 /100 | #179 | Fair $51,818 |
| Immigrants | England | 28.7 /100 | #180 | Fair $51,817 |
| Europeans | 27.6 /100 | #181 | Fair $51,796 |
| Jordanians | 27.6 /100 | #182 | Fair $51,796 |
| Mexican American Indians | 27.0 /100 | #183 | Fair $51,783 |
| Paiute | 25.1 /100 | #184 | Fair $51,743 |
| Immigrants | Latvia | 24.8 /100 | #185 | Fair $51,737 |
| Alaskan Athabascans | 23.8 /100 | #186 | Fair $51,713 |
| Immigrants | South Africa | 23.4 /100 | #187 | Fair $51,705 |
| Northern Europeans | 22.2 /100 | #188 | Fair $51,678 |
| Croatians | 21.6 /100 | #189 | Fair $51,662 |
| Malaysians | 19.7 /100 | #190 | Poor $51,615 |
| Panamanians | 19.5 /100 | #191 | Poor $51,611 |