White/Caucasian vs Swedish Householder Income Under 25 years
COMPARE
White/Caucasian
Swedish
Householder Income Under 25 years
Householder Income Under 25 years Comparison
Whites/Caucasians
Swedes
$50,336
HOUSEHOLDER INCOME UNDER 25 YEARS
1.1/ 100
METRIC RATING
258th/ 347
METRIC RANK
$52,986
HOUSEHOLDER INCOME UNDER 25 YEARS
87.5/ 100
METRIC RATING
143rd/ 347
METRIC RANK
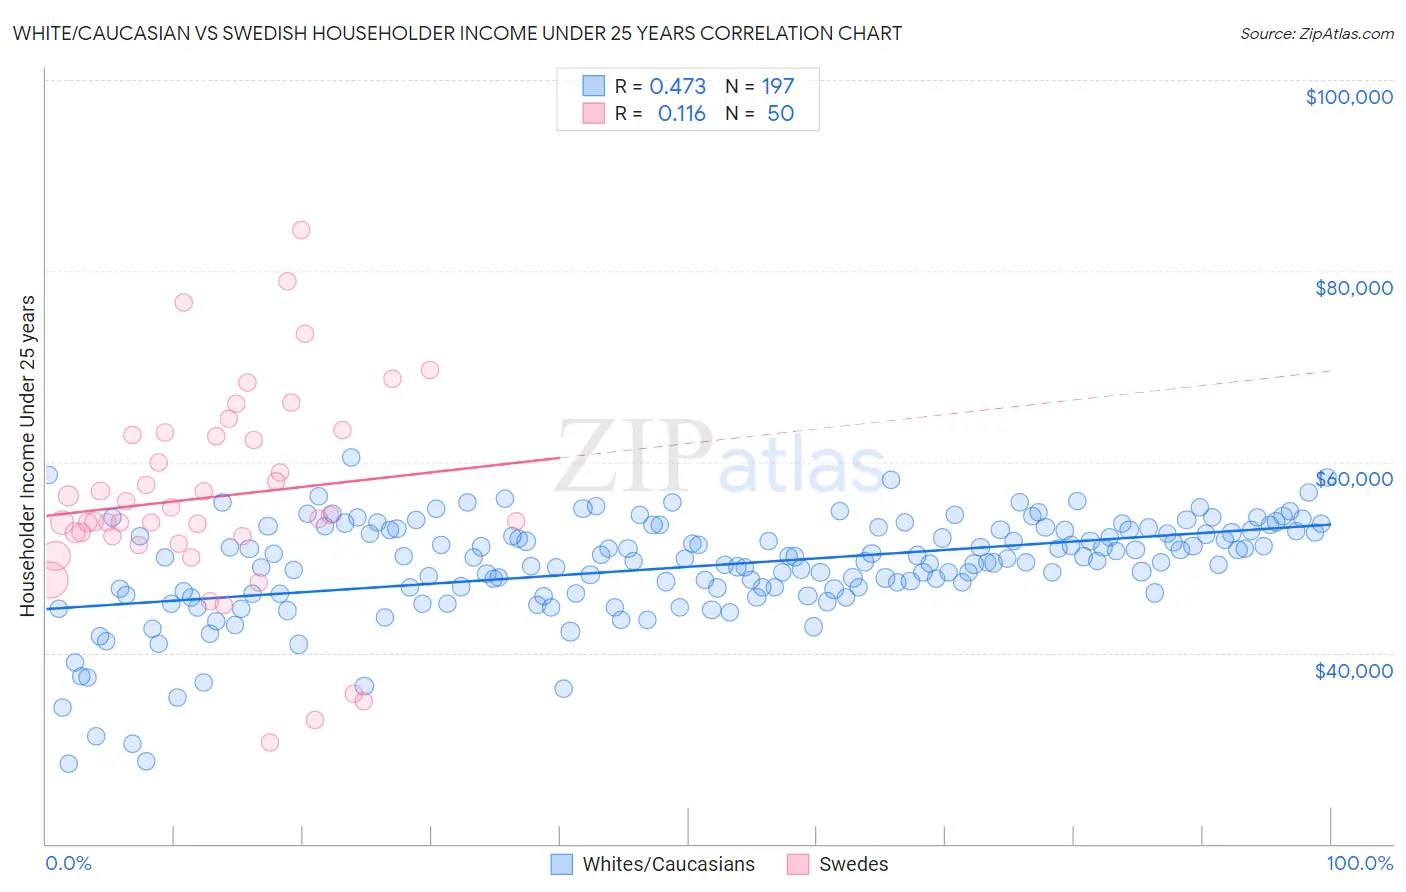
White/Caucasian vs Swedish Householder Income Under 25 years Correlation Chart
The statistical analysis conducted on geographies consisting of 438,814,939 people shows a moderate positive correlation between the proportion of Whites/Caucasians and household income with householder under the age of 25 in the United States with a correlation coefficient (R) of 0.473 and weighted average of $50,336. Similarly, the statistical analysis conducted on geographies consisting of 422,891,046 people shows a poor positive correlation between the proportion of Swedes and household income with householder under the age of 25 in the United States with a correlation coefficient (R) of 0.116 and weighted average of $52,986, a difference of 5.3%.
Householder Income Under 25 years Correlation Summary
| Measurement | White/Caucasian | Swedish |
| Minimum | $28,432 | $30,603 |
| Maximum | $60,456 | $84,275 |
| Range | $32,024 | $53,673 |
| Mean | $49,043 | $56,322 |
| Median | $49,887 | $54,225 |
| Interquartile 25% (IQ1) | $46,371 | $52,194 |
| Interquartile 75% (IQ3) | $52,865 | $62,766 |
| Interquartile Range (IQR) | $6,494 | $10,572 |
| Standard Deviation (Sample) | $5,415 | $10,808 |
| Standard Deviation (Population) | $5,401 | $10,700 |
Similar Demographics by Householder Income Under 25 years
Demographics Similar to Whites/Caucasians by Householder Income Under 25 years
In terms of householder income under 25 years, the demographic groups most similar to Whites/Caucasians are Lebanese ($50,355, a difference of 0.040%), Immigrants from Dominica ($50,301, a difference of 0.070%), Aleut ($50,377, a difference of 0.080%), Immigrants from Cuba ($50,374, a difference of 0.080%), and Luxembourger ($50,379, a difference of 0.090%).
| Demographics | Rating | Rank | Householder Income Under 25 years |
| Celtics | 1.4 /100 | #251 | Tragic $50,447 |
| Immigrants | Mexico | 1.3 /100 | #252 | Tragic $50,422 |
| Immigrants | Haiti | 1.2 /100 | #253 | Tragic $50,398 |
| Luxembourgers | 1.2 /100 | #254 | Tragic $50,379 |
| Aleuts | 1.2 /100 | #255 | Tragic $50,377 |
| Immigrants | Cuba | 1.2 /100 | #256 | Tragic $50,374 |
| Lebanese | 1.1 /100 | #257 | Tragic $50,355 |
| Whites/Caucasians | 1.1 /100 | #258 | Tragic $50,336 |
| Immigrants | Dominica | 1.0 /100 | #259 | Tragic $50,301 |
| Hispanics or Latinos | 0.9 /100 | #260 | Tragic $50,279 |
| Hungarians | 0.9 /100 | #261 | Tragic $50,247 |
| Haitians | 0.8 /100 | #262 | Tragic $50,231 |
| Immigrants | Dominican Republic | 0.8 /100 | #263 | Tragic $50,204 |
| Fijians | 0.6 /100 | #264 | Tragic $50,132 |
| Belgians | 0.6 /100 | #265 | Tragic $50,113 |
Demographics Similar to Swedes by Householder Income Under 25 years
In terms of householder income under 25 years, the demographic groups most similar to Swedes are Immigrants from Armenia ($52,986, a difference of 0.0%), South American Indian ($52,979, a difference of 0.010%), Immigrants from Western Europe ($52,957, a difference of 0.050%), Danish ($53,041, a difference of 0.10%), and Hawaiian ($53,078, a difference of 0.17%).
| Demographics | Rating | Rank | Householder Income Under 25 years |
| Armenians | 91.8 /100 | #136 | Exceptional $53,179 |
| Immigrants | Barbados | 91.5 /100 | #137 | Exceptional $53,163 |
| Norwegians | 90.8 /100 | #138 | Exceptional $53,127 |
| Costa Ricans | 90.4 /100 | #139 | Exceptional $53,106 |
| Hawaiians | 89.8 /100 | #140 | Excellent $53,078 |
| Danes | 88.9 /100 | #141 | Excellent $53,041 |
| Immigrants | Armenia | 87.5 /100 | #142 | Excellent $52,986 |
| Swedes | 87.5 /100 | #143 | Excellent $52,986 |
| South American Indians | 87.3 /100 | #144 | Excellent $52,979 |
| Immigrants | Western Europe | 86.7 /100 | #145 | Excellent $52,957 |
| Immigrants | Hungary | 81.6 /100 | #146 | Excellent $52,798 |
| Latvians | 81.0 /100 | #147 | Excellent $52,783 |
| French Canadians | 76.5 /100 | #148 | Good $52,672 |
| Scandinavians | 75.7 /100 | #149 | Good $52,654 |
| Immigrants | Costa Rica | 75.2 /100 | #150 | Good $52,643 |