Immigrants from Dominica Householder Income Under 25 years

COMPARE

Immigrants from Dominica
Race
Ancestry
AfghanAfricanAlaska NativeAlaskan AthabascanAlbanianAleutAlsatianAmericanApacheArabArapahoArgentineanArmenianAssyrian/Chaldean/SyriacAustralianAustrianBahamianBangladeshiBarbadianBasqueBelgianBelizeanBermudanBhutaneseBlackfeetBolivianBrazilianBritishBritish West IndianBulgarianBurmeseCajunCambodianCanadianCape VerdeanCarpatho RusynCelticCentral AmericanCentral American IndianCherokeeCheyenneChickasawChileanChineseChippewaChoctawColombianColvilleComancheCosta RicanCreeCreekCroatianCrowCubanCypriotCzechCzechoslovakianDanishDelawareDominicanDutchDutch West IndianEastern EuropeanEcuadorianEgyptianEnglishEstonianEthiopianEuropeanFijianFilipinoFinnishFrenchFrench American IndianFrench CanadianGermanGerman RussianGhanaianGreekGuamanian/ChamorroGuatemalanGuyaneseHaitianHmongHonduranHopiHoumaHungarianIcelanderIndian (Asian)IndonesianInupiatIranianIraqiIrishIroquoisIsraeliItalianJamaicanJapaneseJordanianKenyanKiowaKoreanLaotianLatvianLebaneseLiberianLithuanianLumbeeLuxembourgerMacedonianMalaysianMalteseMarshalleseMenomineeMexicanMexican American IndianMongolianMoroccanNative HawaiianNavajoNepaleseNew ZealanderNicaraguanNigerianNorthern EuropeanNorwegianOkinawanOsageOttawaPaiutePakistaniPalestinianPanamanianParaguayanPennsylvania GermanPeruvianPimaPolishPortuguesePotawatomiPuebloPuerto RicanPuget Sound SalishRomanianRussianSalvadoranSamoanScandinavianScotch-IrishScottishSeminoleSenegaleseSerbianShoshoneSierra LeoneanSiouxSlavicSlovakSloveneSomaliSouth AfricanSouth AmericanSouth American IndianSoviet UnionSpaniardSpanishSpanish AmericanSpanish American IndianSri LankanSubsaharan AfricanSudaneseSwedishSwissSyrianTaiwaneseThaiTlingit-HaidaTohono O'OdhamTonganTrinidadian and TobagonianTsimshianTurkishU.S. Virgin IslanderUgandanUkrainianUruguayanUteVenezuelanVietnameseWelshWest IndianYakamaYaquiYugoslavianYumanYup'ikZimbabwean
Immigration
NonimmigrantsImmigrantsAfghanistanAfricaAlbaniaArgentinaArmeniaAsiaAustraliaAustriaBahamasBangladeshBarbadosBelarusBelgiumBelizeBoliviaBosnia and HerzegovinaBrazilBulgariaBurma/MyanmarCabo VerdeCambodiaCameroonCanadaCaribbeanCentral AmericaChileChinaColombiaCongoCosta RicaCroatiaCubaCzechoslovakiaDenmarkDominicaDominican RepublicEastern AfricaEastern AsiaEastern EuropeEcuadorEgyptEl SalvadorEnglandEritreaEthiopiaEuropeFijiFranceGermanyGhanaGreeceGrenadaGuatemalaGuyanaHaitiHondurasHong KongHungaryIndiaIndonesiaIranIraqIrelandIsraelItalyJamaicaJapanJordanKazakhstanKenyaKoreaKuwaitLaosLatin AmericaLatviaLebanonLiberiaLithuaniaMalaysiaMexicoMicronesiaMiddle AfricaMoldovaMoroccoNepalNetherlandsNicaraguaNigeriaNorth AmericaNorth MacedoniaNorthern AfricaNorthern EuropeNorwayOceaniaPakistanPanamaPeruPhilippinesPolandPortugalRomaniaRussiaSaudi ArabiaScotlandSenegalSerbiaSierra LeoneSingaporeSomaliaSouth AfricaSouth AmericaSouth Central AsiaSouth Eastern AsiaSouthern EuropeSpainSri LankaSt. Vincent and the GrenadinesSudanSwedenSwitzerlandSyriaTaiwanThailandTrinidad and TobagoTurkeyUgandaUkraineUruguayUzbekistanVenezuelaVietnamWest IndiesWestern AfricaWestern AsiaWestern EuropeYemenZaireZimbabweAzores
Select to Compare
Race
Ancestry
AfghanAfricanAlaska NativeAlaskan AthabascanAlbanianAleutAlsatianAmericanApacheArabArapahoArgentineanArmenianAssyrian/Chaldean/SyriacAustralianAustrianBahamianBangladeshiBarbadianBasqueBelgianBelizeanBermudanBhutaneseBlackfeetBolivianBrazilianBritishBritish West IndianBulgarianBurmeseCajunCambodianCanadianCape VerdeanCarpatho RusynCelticCentral AmericanCentral American IndianCherokeeCheyenneChickasawChileanChineseChippewaChoctawColombianColvilleComancheCosta RicanCreeCreekCroatianCrowCubanCypriotCzechCzechoslovakianDanishDelawareDominicanDutchDutch West IndianEastern EuropeanEcuadorianEgyptianEnglishEstonianEthiopianEuropeanFijianFilipinoFinnishFrenchFrench American IndianFrench CanadianGermanGerman RussianGhanaianGreekGuamanian/ChamorroGuatemalanGuyaneseHaitianHmongHonduranHopiHoumaHungarianIcelanderIndian (Asian)IndonesianInupiatIranianIraqiIrishIroquoisIsraeliItalianJamaicanJapaneseJordanianKenyanKiowaKoreanLaotianLatvianLebaneseLiberianLithuanianLumbeeLuxembourgerMacedonianMalaysianMalteseMarshalleseMenomineeMexicanMexican American IndianMongolianMoroccanNative HawaiianNavajoNepaleseNew ZealanderNicaraguanNigerianNorthern EuropeanNorwegianOkinawanOsageOttawaPaiutePakistaniPalestinianPanamanianParaguayanPennsylvania GermanPeruvianPimaPolishPortuguesePotawatomiPuebloPuerto RicanPuget Sound SalishRomanianRussianSalvadoranSamoanScandinavianScotch-IrishScottishSeminoleSenegaleseSerbianShoshoneSierra LeoneanSiouxSlavicSlovakSloveneSomaliSouth AfricanSouth AmericanSouth American IndianSoviet UnionSpaniardSpanishSpanish AmericanSpanish American IndianSri LankanSubsaharan AfricanSudaneseSwedishSwissSyrianTaiwaneseThaiTlingit-HaidaTohono O'OdhamTonganTrinidadian and TobagonianTsimshianTurkishU.S. Virgin IslanderUgandanUkrainianUruguayanUteVenezuelanVietnameseWelshWest IndianYakamaYaquiYugoslavianYumanYup'ikZimbabwean
Immigration
NonimmigrantsImmigrantsAfghanistanAfricaAlbaniaArgentinaArmeniaAsiaAustraliaAustriaBahamasBangladeshBarbadosBelarusBelgiumBelizeBoliviaBosnia and HerzegovinaBrazilBulgariaBurma/MyanmarCabo VerdeCambodiaCameroonCanadaCaribbeanCentral AmericaChileChinaColombiaCongoCosta RicaCroatiaCubaCzechoslovakiaDenmarkDominican RepublicEastern AfricaEastern AsiaEastern EuropeEcuadorEgyptEl SalvadorEnglandEritreaEthiopiaEuropeFijiFranceGermanyGhanaGreeceGrenadaGuatemalaGuyanaHaitiHondurasHong KongHungaryIndiaIndonesiaIranIraqIrelandIsraelItalyJamaicaJapanJordanKazakhstanKenyaKoreaKuwaitLaosLatin AmericaLatviaLebanonLiberiaLithuaniaMalaysiaMexicoMicronesiaMiddle AfricaMoldovaMoroccoNepalNetherlandsNicaraguaNigeriaNorth AmericaNorth MacedoniaNorthern AfricaNorthern EuropeNorwayOceaniaPakistanPanamaPeruPhilippinesPolandPortugalRomaniaRussiaSaudi ArabiaScotlandSenegalSerbiaSierra LeoneSingaporeSomaliaSouth AfricaSouth AmericaSouth Central AsiaSouth Eastern AsiaSouthern EuropeSpainSri LankaSt. Vincent and the GrenadinesSudanSwedenSwitzerlandSyriaTaiwanThailandTrinidad and TobagoTurkeyUgandaUkraineUruguayUzbekistanVenezuelaVietnamWest IndiesWestern AfricaWestern AsiaWestern EuropeYemenZaireZimbabweAzores
Householder Income Under 25 years
Income
Poverty
Unemployment
Labor Participation
Family Structure
Vehicle Availability
Education Level
Disability

Immigrants from Dominica Householder Income Under 25 years
Tragic

$50,301
HOUSEHOLD INCOME | AGE < 25
1.0/ 100
METRIC RATING
259th/ 347
METRIC RANK

Immigrants from Dominica Householder Income Under 25 years Correlation Chart

The statistical analysis conducted on geographies consisting of 77,753,008 people shows a mild negative correlation between the proportion of Immigrants from Dominica and household income with householder under the age of 25 in the United States with a correlation coefficient (R) of -0.361 and weighted average of $50,301. On average, for every 1% (one percent) increase in Immigrants from Dominica within a typical geography, there is a decrease of $5,884 in household income with householder under the age of 25.
Immigrants from Dominica Householder Income Under 25 years
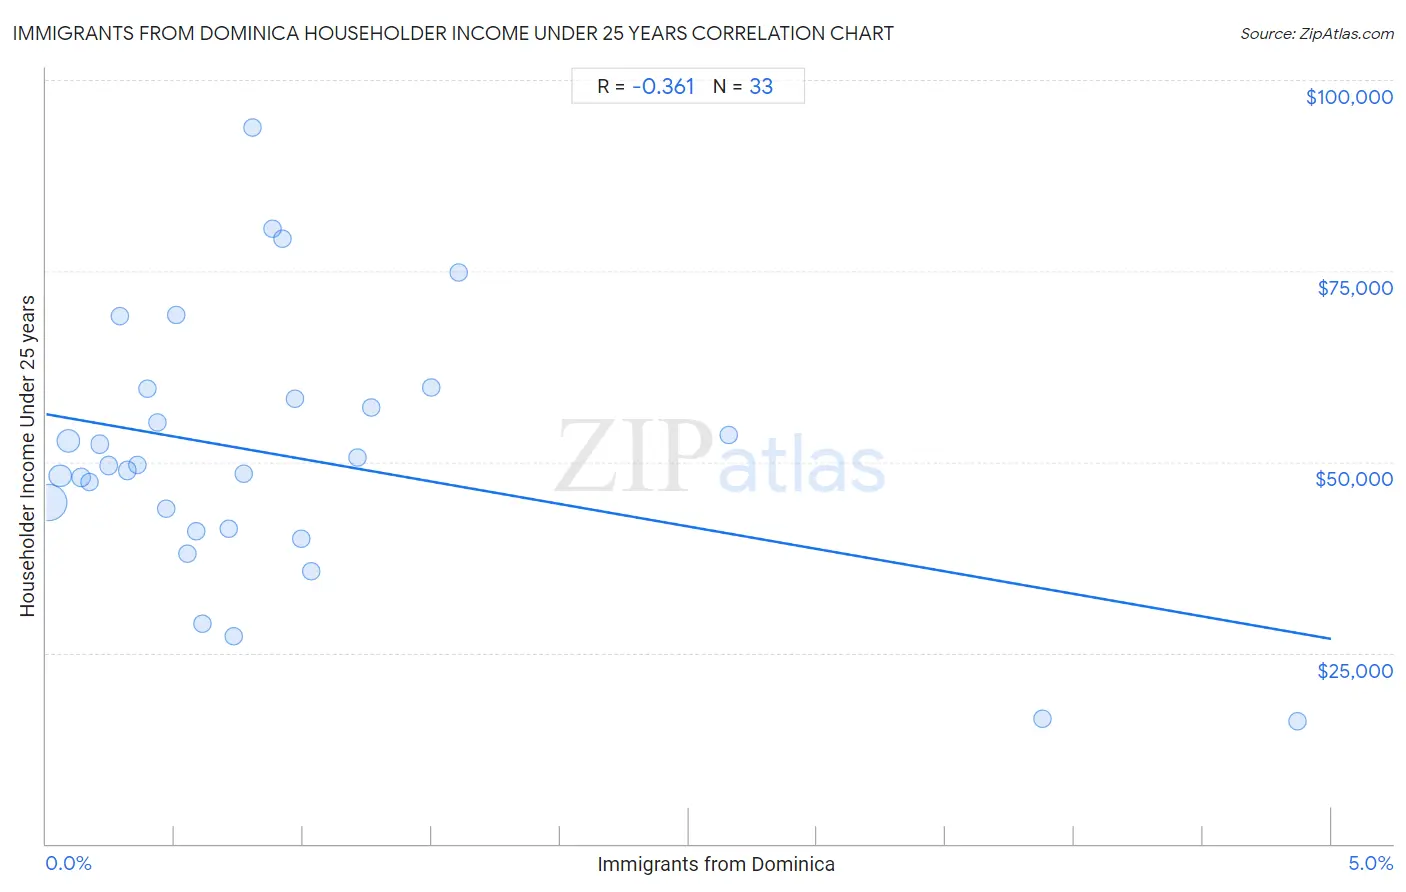
It is essential to understand that the correlation between the percentage of Immigrants from Dominica and household income with householder under the age of 25 does not imply a direct cause-and-effect relationship. It remains uncertain whether the presence of Immigrants from Dominica influences an upward or downward trend in the level of household income with householder under the age of 25 within an area, or if Immigrants from Dominica simply ended up residing in those areas with higher or lower levels of household income with householder under the age of 25 due to other factors.

Demographics Similar to Immigrants from Dominica by Householder Income Under 25 years

In terms of householder income under 25 years, the demographic groups most similar to Immigrants from Dominica are Hispanic or Latino ($50,279, a difference of 0.040%), White/Caucasian ($50,336, a difference of 0.070%), Lebanese ($50,355, a difference of 0.11%), Hungarian ($50,247, a difference of 0.11%), and Haitian ($50,231, a difference of 0.14%).
DemographicsRating | RankHouseholder Income Under 25 years
Immigrants from Mexico
1.3
/100
|
#252
Tragic
$50,422
Immigrants from Haiti
1.2
/100
|
#253
Tragic
$50,398
Luxembourgers
1.2
/100
|
#254
Tragic
$50,379
Aleuts
1.2
/100
|
#255
Tragic
$50,377
Immigrants from Cuba
1.2
/100
|
#256
Tragic
$50,374
Lebanese
1.1
/100
|
#257
Tragic
$50,355
Whites/Caucasians
1.1
/100
|
#258
Tragic
$50,336
Immigrants from Dominica
1.0
/100
|
#259
Tragic
$50,301
Hispanics or Latinos
0.9
/100
|
#260
Tragic
$50,279
Hungarians
0.9
/100
|
#261
Tragic
$50,247
Haitians
0.8
/100
|
#262
Tragic
$50,231
Immigrants from Dominican Republic
0.8
/100
|
#263
Tragic
$50,204
Fijians
0.6
/100
|
#264
Tragic
$50,132
Belgians
0.6
/100
|
#265
Tragic
$50,113
Immigrants from Venezuela
0.6
/100
|
#266
Tragic
$50,109

Immigrants from Dominica Householder Income Under 25 years Correlation Summary

MeasurementImmigrants from Dominica DataHouseholder Income Under 25 years Data
Minimum0.010%$16,120
Maximum4.9%$93,750
Range4.9%$77,630
Mean0.91%$50,859
Median0.61%$49,516
Interquartile 25% (IQ1)0.30%$41,058
Interquartile 75% (IQ3)1.0%$58,934
Interquartile Range (IQR)0.71%$17,875
Standard Deviation (Sample)1.0%$17,077
Standard Deviation (Population)1.0%$16,816

Correlation Details

Immigrants from Dominica PercentileSample SizeHouseholder Income Under 25 years
[
0.0%
-
0.5%
]
0.010%
43,192,272$44,606
[
0.0%
-
0.5%
]
0.056%
10,563,093$48,179
[
0.0%
-
0.5%
]
0.087%
13,125,077$52,750
[
0.0%
-
0.5%
]
0.14%
3,435,973$47,909
[
0.0%
-
0.5%
]
0.17%
2,115,310$47,381
[
0.0%
-
0.5%
]
0.21%
1,010,953$52,321
[
0.0%
-
0.5%
]
0.24%
414,874$49,516
[
0.0%
-
0.5%
]
0.28%
601,047$69,023
[
0.0%
-
0.5%
]
0.32%
806,763$48,893
[
0.0%
-
0.5%
]
0.35%
470,782$49,593
[
0.0%
-
0.5%
]
0.39%
255,959$59,614
[
0.0%
-
0.5%
]
0.43%
309,328$55,179
[
0.0%
-
0.5%
]
0.47%
230,847$43,806
[
0.5%
-
1.0%
]
0.50%
50,715$69,297
[
0.5%
-
1.0%
]
0.55%
276,868$38,050
[
0.5%
-
1.0%
]
0.58%
107,796$40,866
[
0.5%
-
1.0%
]
0.61%
216,101$28,875
[
0.5%
-
1.0%
]
0.71%
3,661$41,250
[
0.5%
-
1.0%
]
0.73%
69,830$27,182
[
0.5%
-
1.0%
]
0.77%
119,397$48,370
[
0.5%
-
1.0%
]
0.80%
6,861$93,750
[
0.5%
-
1.0%
]
0.88%
49,963$80,544
[
0.5%
-
1.0%
]
0.92%
169,320$79,279
[
0.5%
-
1.0%
]
0.97%
47,066$58,253
[
0.5%
-
1.0%
]
0.99%
606$40,000
[
1.0%
-
1.5%
]
1.03%
29,332$35,684
[
1.0%
-
1.5%
]
1.21%
2,561$50,500
[
1.0%
-
1.5%
]
1.26%
42,689$57,167
[
1.0%
-
1.5%
]
1.50%
10,610$59,750
[
1.5%
-
2.0%
]
1.61%
6,977$74,844
[
2.5%
-
3.0%
]
2.65%
829$53,438
[
3.5%
-
4.0%
]
3.88%
5,315$16,344
[
4.5%
-
5.0%
]
4.87%
4,233$16,120