White/Caucasian vs Peruvian Householder Income Under 25 years
COMPARE
White/Caucasian
Peruvian
Householder Income Under 25 years
Householder Income Under 25 years Comparison
Whites/Caucasians
Peruvians
$50,336
HOUSEHOLDER INCOME UNDER 25 YEARS
1.1/ 100
METRIC RATING
258th/ 347
METRIC RANK
$56,052
HOUSEHOLDER INCOME UNDER 25 YEARS
100.0/ 100
METRIC RATING
32nd/ 347
METRIC RANK
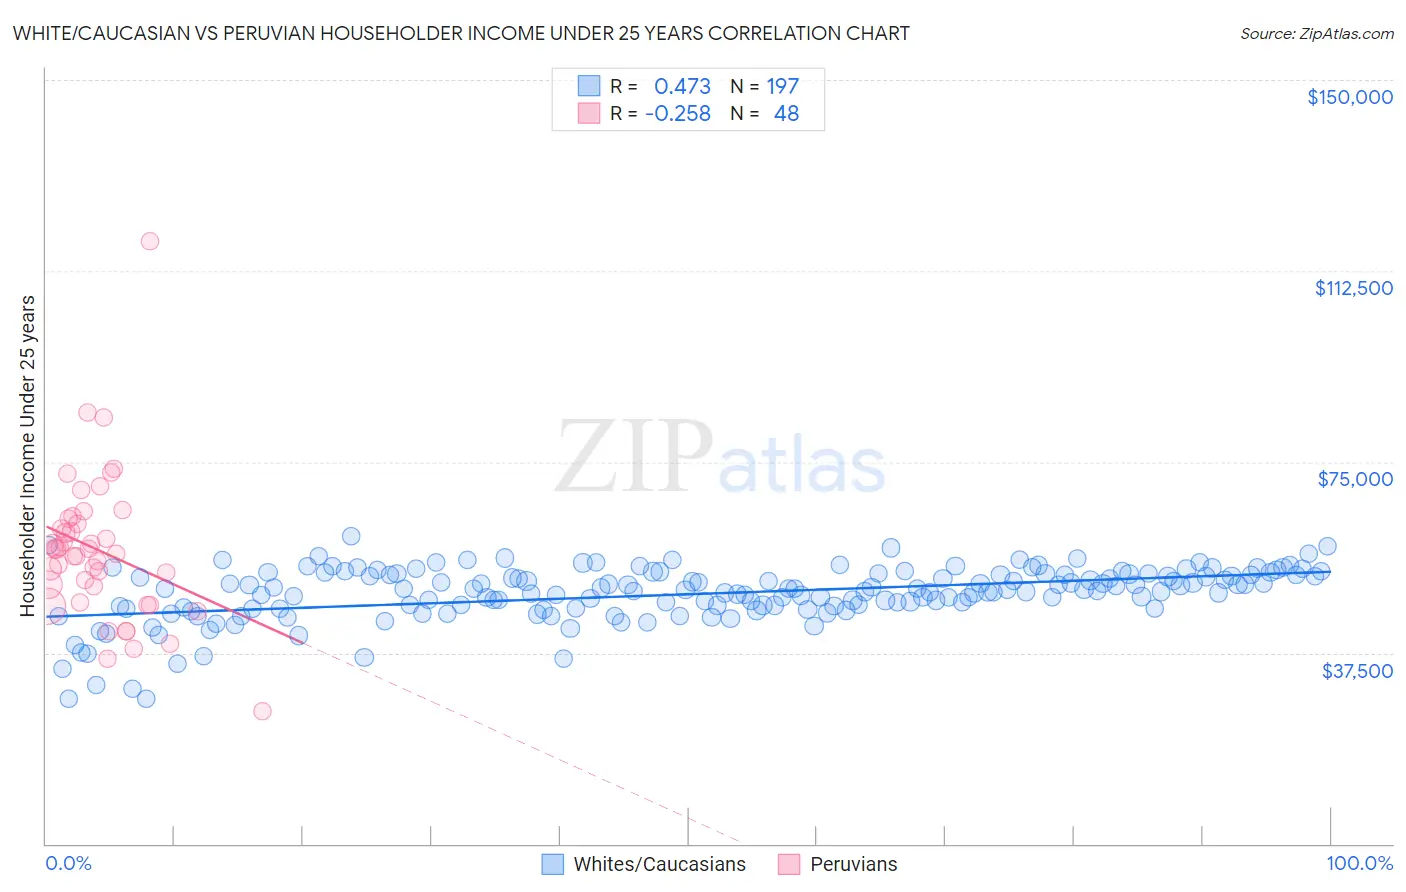
White/Caucasian vs Peruvian Householder Income Under 25 years Correlation Chart
The statistical analysis conducted on geographies consisting of 438,814,939 people shows a moderate positive correlation between the proportion of Whites/Caucasians and household income with householder under the age of 25 in the United States with a correlation coefficient (R) of 0.473 and weighted average of $50,336. Similarly, the statistical analysis conducted on geographies consisting of 309,109,247 people shows a weak negative correlation between the proportion of Peruvians and household income with householder under the age of 25 in the United States with a correlation coefficient (R) of -0.258 and weighted average of $56,052, a difference of 11.4%.
Householder Income Under 25 years Correlation Summary
| Measurement | White/Caucasian | Peruvian |
| Minimum | $28,432 | $25,923 |
| Maximum | $60,456 | $118,438 |
| Range | $32,024 | $92,515 |
| Mean | $49,043 | $57,665 |
| Median | $49,887 | $57,415 |
| Interquartile 25% (IQ1) | $46,371 | $48,987 |
| Interquartile 75% (IQ3) | $52,865 | $63,410 |
| Interquartile Range (IQR) | $6,494 | $14,423 |
| Standard Deviation (Sample) | $5,415 | $14,693 |
| Standard Deviation (Population) | $5,401 | $14,539 |
Similar Demographics by Householder Income Under 25 years
Demographics Similar to Whites/Caucasians by Householder Income Under 25 years
In terms of householder income under 25 years, the demographic groups most similar to Whites/Caucasians are Lebanese ($50,355, a difference of 0.040%), Immigrants from Dominica ($50,301, a difference of 0.070%), Aleut ($50,377, a difference of 0.080%), Immigrants from Cuba ($50,374, a difference of 0.080%), and Luxembourger ($50,379, a difference of 0.090%).
| Demographics | Rating | Rank | Householder Income Under 25 years |
| Celtics | 1.4 /100 | #251 | Tragic $50,447 |
| Immigrants | Mexico | 1.3 /100 | #252 | Tragic $50,422 |
| Immigrants | Haiti | 1.2 /100 | #253 | Tragic $50,398 |
| Luxembourgers | 1.2 /100 | #254 | Tragic $50,379 |
| Aleuts | 1.2 /100 | #255 | Tragic $50,377 |
| Immigrants | Cuba | 1.2 /100 | #256 | Tragic $50,374 |
| Lebanese | 1.1 /100 | #257 | Tragic $50,355 |
| Whites/Caucasians | 1.1 /100 | #258 | Tragic $50,336 |
| Immigrants | Dominica | 1.0 /100 | #259 | Tragic $50,301 |
| Hispanics or Latinos | 0.9 /100 | #260 | Tragic $50,279 |
| Hungarians | 0.9 /100 | #261 | Tragic $50,247 |
| Haitians | 0.8 /100 | #262 | Tragic $50,231 |
| Immigrants | Dominican Republic | 0.8 /100 | #263 | Tragic $50,204 |
| Fijians | 0.6 /100 | #264 | Tragic $50,132 |
| Belgians | 0.6 /100 | #265 | Tragic $50,113 |
Demographics Similar to Peruvians by Householder Income Under 25 years
In terms of householder income under 25 years, the demographic groups most similar to Peruvians are Vietnamese ($56,127, a difference of 0.13%), Immigrants from Moldova ($56,168, a difference of 0.21%), Inupiat ($55,935, a difference of 0.21%), Immigrants from Japan ($55,932, a difference of 0.21%), and Tlingit-Haida ($55,914, a difference of 0.25%).
| Demographics | Rating | Rank | Householder Income Under 25 years |
| Immigrants | Pakistan | 100.0 /100 | #25 | Exceptional $56,789 |
| Immigrants | Australia | 100.0 /100 | #26 | Exceptional $56,660 |
| Immigrants | North Macedonia | 100.0 /100 | #27 | Exceptional $56,503 |
| Immigrants | Peru | 100.0 /100 | #28 | Exceptional $56,384 |
| Immigrants | Asia | 100.0 /100 | #29 | Exceptional $56,379 |
| Immigrants | Moldova | 100.0 /100 | #30 | Exceptional $56,168 |
| Vietnamese | 100.0 /100 | #31 | Exceptional $56,127 |
| Peruvians | 100.0 /100 | #32 | Exceptional $56,052 |
| Inupiat | 100.0 /100 | #33 | Exceptional $55,935 |
| Immigrants | Japan | 100.0 /100 | #34 | Exceptional $55,932 |
| Tlingit-Haida | 100.0 /100 | #35 | Exceptional $55,914 |
| Immigrants | Israel | 100.0 /100 | #36 | Exceptional $55,913 |
| Immigrants | Russia | 100.0 /100 | #37 | Exceptional $55,891 |
| Immigrants | Iran | 100.0 /100 | #38 | Exceptional $55,880 |
| Immigrants | Belarus | 100.0 /100 | #39 | Exceptional $55,743 |