White/Caucasian vs Irish Disability Age 65 to 74
COMPARE
White/Caucasian
Irish
Disability Age 65 to 74
Disability Age 65 to 74 Comparison
Whites/Caucasians
Irish
24.2%
DISABILITY AGE 65 TO 74
6.6/ 100
METRIC RATING
228th/ 347
METRIC RANK
23.4%
DISABILITY AGE 65 TO 74
44.4/ 100
METRIC RATING
182nd/ 347
METRIC RANK
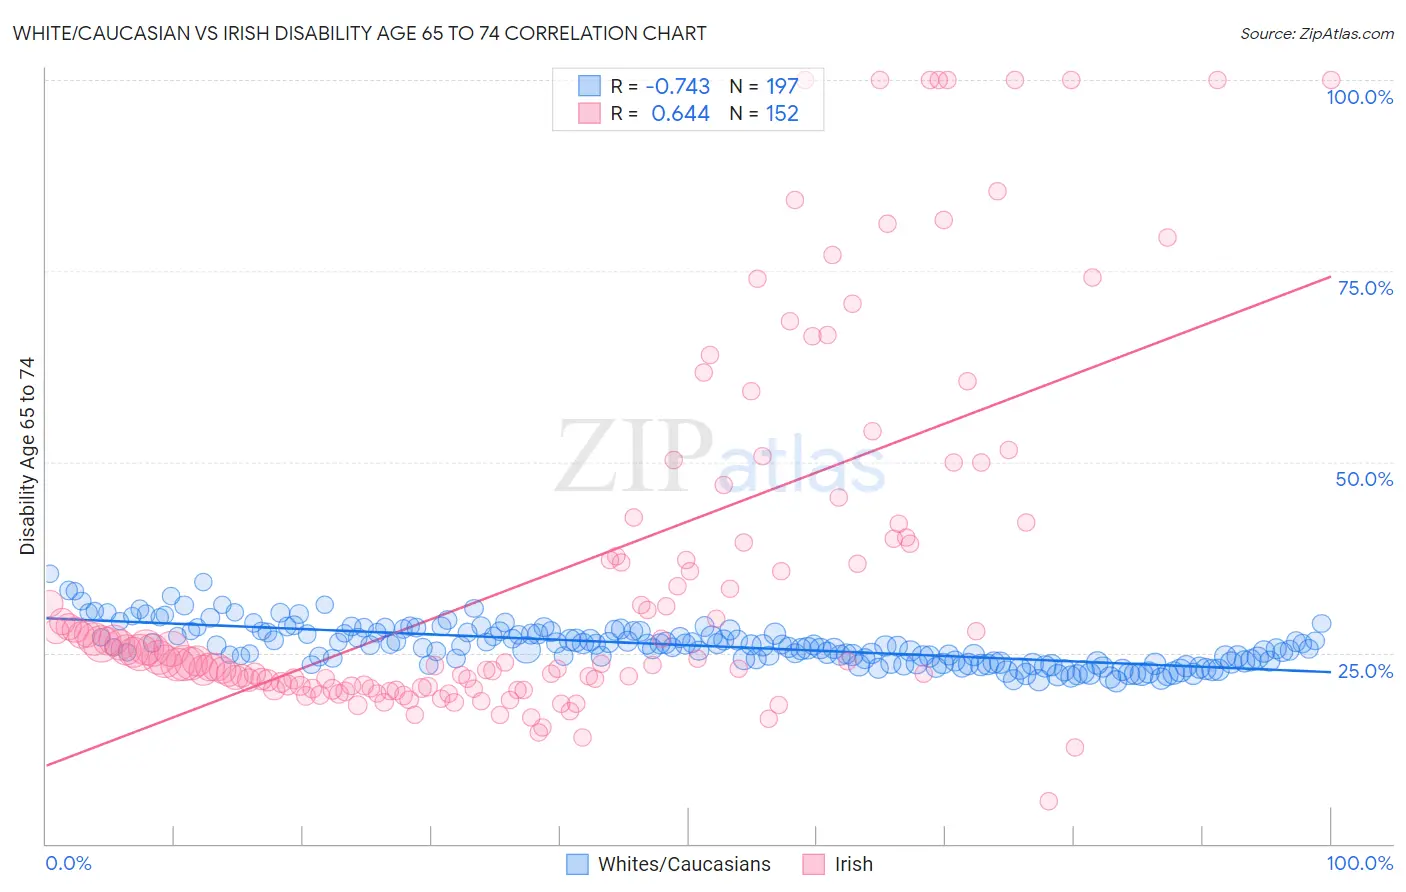
White/Caucasian vs Irish Disability Age 65 to 74 Correlation Chart
The statistical analysis conducted on geographies consisting of 580,018,355 people shows a strong negative correlation between the proportion of Whites/Caucasians and percentage of population with a disability between the ages 65 and 75 in the United States with a correlation coefficient (R) of -0.743 and weighted average of 24.2%. Similarly, the statistical analysis conducted on geographies consisting of 577,447,046 people shows a significant positive correlation between the proportion of Irish and percentage of population with a disability between the ages 65 and 75 in the United States with a correlation coefficient (R) of 0.644 and weighted average of 23.4%, a difference of 3.5%.
Disability Age 65 to 74 Correlation Summary
| Measurement | White/Caucasian | Irish |
| Minimum | 21.3% | 5.6% |
| Maximum | 35.4% | 100.0% |
| Range | 14.1% | 94.4% |
| Mean | 26.0% | 35.1% |
| Median | 25.8% | 23.9% |
| Interquartile 25% (IQ1) | 23.7% | 20.6% |
| Interquartile 75% (IQ3) | 27.7% | 39.7% |
| Interquartile Range (IQR) | 4.0% | 19.1% |
| Standard Deviation (Sample) | 2.7% | 23.3% |
| Standard Deviation (Population) | 2.7% | 23.3% |
Similar Demographics by Disability Age 65 to 74
Demographics Similar to Whites/Caucasians by Disability Age 65 to 74
In terms of disability age 65 to 74, the demographic groups most similar to Whites/Caucasians are Celtic (24.2%, a difference of 0.050%), Barbadian (24.3%, a difference of 0.16%), Nigerian (24.2%, a difference of 0.25%), Iraqi (24.2%, a difference of 0.31%), and Bermudan (24.2%, a difference of 0.32%).
| Demographics | Rating | Rank | Disability Age 65 to 74 |
| Immigrants | Nicaragua | 9.8 /100 | #221 | Tragic 24.1% |
| Native Hawaiians | 9.3 /100 | #222 | Tragic 24.1% |
| Immigrants | Middle Africa | 8.9 /100 | #223 | Tragic 24.1% |
| Immigrants | Panama | 8.6 /100 | #224 | Tragic 24.1% |
| Bermudans | 8.2 /100 | #225 | Tragic 24.2% |
| Iraqis | 8.1 /100 | #226 | Tragic 24.2% |
| Nigerians | 7.8 /100 | #227 | Tragic 24.2% |
| Whites/Caucasians | 6.6 /100 | #228 | Tragic 24.2% |
| Celtics | 6.4 /100 | #229 | Tragic 24.2% |
| Barbadians | 6.0 /100 | #230 | Tragic 24.3% |
| Immigrants | Thailand | 5.2 /100 | #231 | Tragic 24.3% |
| Immigrants | Zaire | 5.0 /100 | #232 | Tragic 24.3% |
| Bahamians | 4.5 /100 | #233 | Tragic 24.4% |
| Panamanians | 4.2 /100 | #234 | Tragic 24.4% |
| Scotch-Irish | 3.8 /100 | #235 | Tragic 24.4% |
Demographics Similar to Irish by Disability Age 65 to 74
In terms of disability age 65 to 74, the demographic groups most similar to Irish are Assyrian/Chaldean/Syriac (23.4%, a difference of 0.060%), Scandinavian (23.4%, a difference of 0.070%), Immigrants from Sierra Leone (23.4%, a difference of 0.080%), Guyanese (23.4%, a difference of 0.090%), and Immigrants from Eastern Africa (23.4%, a difference of 0.090%).
| Demographics | Rating | Rank | Disability Age 65 to 74 |
| Dutch | 49.4 /100 | #175 | Average 23.3% |
| Immigrants | Eritrea | 47.5 /100 | #176 | Average 23.4% |
| Immigrants | Haiti | 47.5 /100 | #177 | Average 23.4% |
| Guyanese | 45.8 /100 | #178 | Average 23.4% |
| Immigrants | Sierra Leone | 45.8 /100 | #179 | Average 23.4% |
| Scandinavians | 45.6 /100 | #180 | Average 23.4% |
| Assyrians/Chaldeans/Syriacs | 45.3 /100 | #181 | Average 23.4% |
| Irish | 44.4 /100 | #182 | Average 23.4% |
| Immigrants | Eastern Africa | 42.8 /100 | #183 | Average 23.4% |
| Immigrants | Germany | 42.5 /100 | #184 | Average 23.4% |
| Haitians | 42.4 /100 | #185 | Average 23.4% |
| Basques | 38.4 /100 | #186 | Fair 23.5% |
| Portuguese | 37.8 /100 | #187 | Fair 23.5% |
| Immigrants | Cuba | 34.0 /100 | #188 | Fair 23.6% |
| Scottish | 33.1 /100 | #189 | Fair 23.6% |