White/Caucasian vs Irish Unemployment Among Ages 65 to 74 years
COMPARE
White/Caucasian
Irish
Unemployment Among Ages 65 to 74 years
Unemployment Among Ages 65 to 74 years Comparison
Whites/Caucasians
Irish
5.4%
UNEMPLOYMENT AMONG AGES 65 TO 74 YEARS
57.2/ 100
METRIC RATING
168th/ 347
METRIC RANK
5.3%
UNEMPLOYMENT AMONG AGES 65 TO 74 YEARS
74.8/ 100
METRIC RATING
146th/ 347
METRIC RANK
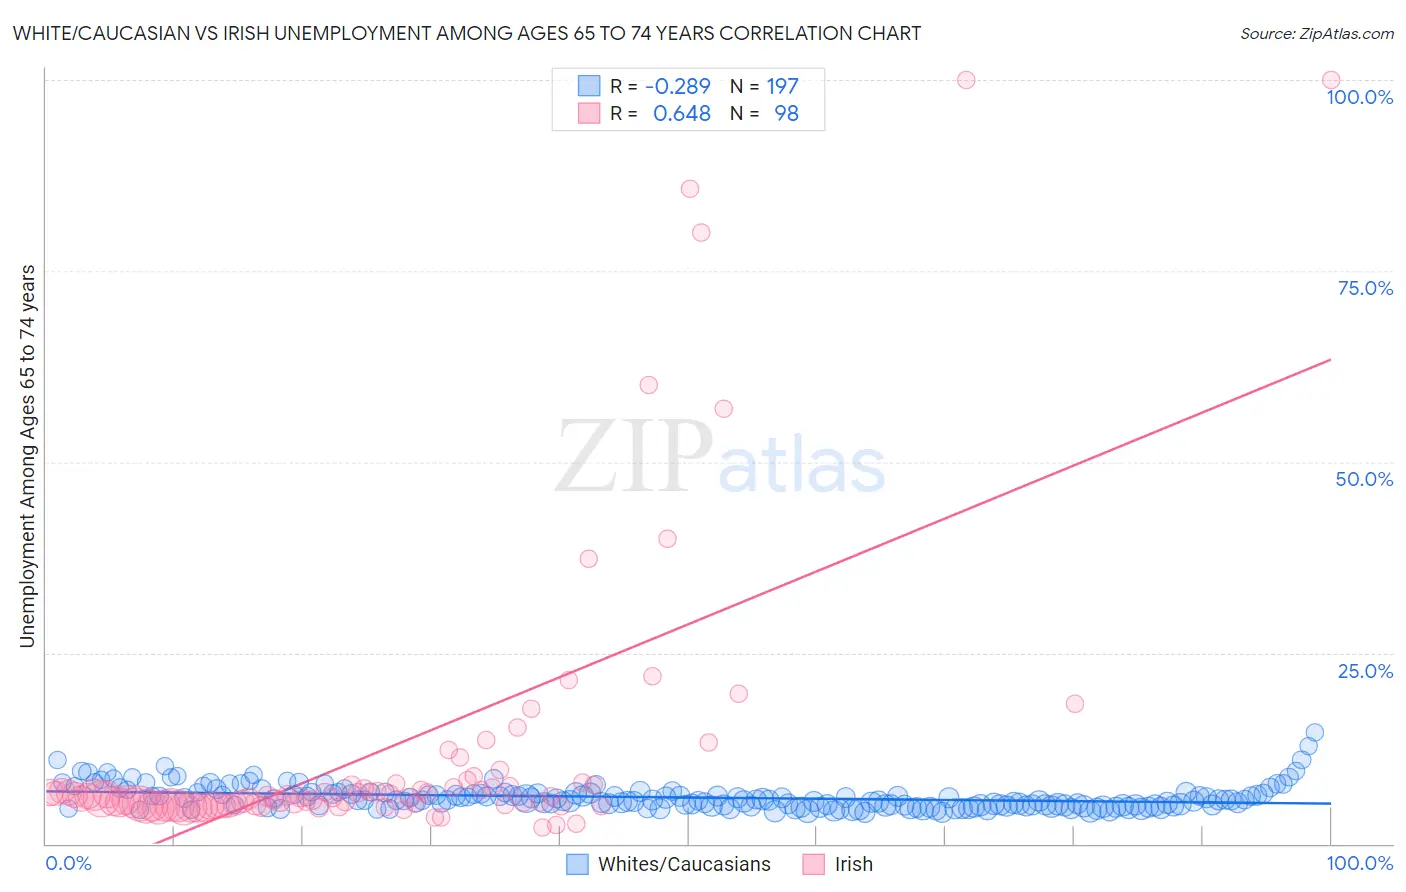
White/Caucasian vs Irish Unemployment Among Ages 65 to 74 years Correlation Chart
The statistical analysis conducted on geographies consisting of 448,882,925 people shows a weak negative correlation between the proportion of Whites/Caucasians and unemployment rate among population between the ages 65 and 74 in the United States with a correlation coefficient (R) of -0.289 and weighted average of 5.4%. Similarly, the statistical analysis conducted on geographies consisting of 447,594,023 people shows a significant positive correlation between the proportion of Irish and unemployment rate among population between the ages 65 and 74 in the United States with a correlation coefficient (R) of 0.648 and weighted average of 5.3%, a difference of 0.67%.
Unemployment Among Ages 65 to 74 years Correlation Summary
| Measurement | White/Caucasian | Irish |
| Minimum | 4.1% | 2.1% |
| Maximum | 14.5% | 100.0% |
| Range | 10.4% | 97.9% |
| Mean | 6.1% | 12.1% |
| Median | 5.7% | 6.1% |
| Interquartile 25% (IQ1) | 5.0% | 5.1% |
| Interquartile 75% (IQ3) | 6.6% | 7.6% |
| Interquartile Range (IQR) | 1.6% | 2.5% |
| Standard Deviation (Sample) | 1.6% | 19.0% |
| Standard Deviation (Population) | 1.6% | 18.9% |
Similar Demographics by Unemployment Among Ages 65 to 74 years
Demographics Similar to Whites/Caucasians by Unemployment Among Ages 65 to 74 years
In terms of unemployment among ages 65 to 74 years, the demographic groups most similar to Whites/Caucasians are Laotian (5.4%, a difference of 0.050%), Slovak (5.3%, a difference of 0.10%), Indian (Asian) (5.3%, a difference of 0.10%), Immigrants from Bosnia and Herzegovina (5.3%, a difference of 0.11%), and Syrian (5.4%, a difference of 0.12%).
| Demographics | Rating | Rank | Unemployment Among Ages 65 to 74 years |
| Immigrants | Italy | 63.7 /100 | #161 | Good 5.3% |
| Immigrants | Eastern Asia | 62.5 /100 | #162 | Good 5.3% |
| Mongolians | 62.3 /100 | #163 | Good 5.3% |
| Immigrants | Philippines | 61.2 /100 | #164 | Good 5.3% |
| Immigrants | Bosnia and Herzegovina | 60.2 /100 | #165 | Good 5.3% |
| Slovaks | 60.0 /100 | #166 | Good 5.3% |
| Indians (Asian) | 59.9 /100 | #167 | Average 5.3% |
| Whites/Caucasians | 57.2 /100 | #168 | Average 5.4% |
| Laotians | 55.7 /100 | #169 | Average 5.4% |
| Syrians | 53.7 /100 | #170 | Average 5.4% |
| Panamanians | 51.8 /100 | #171 | Average 5.4% |
| Greeks | 51.1 /100 | #172 | Average 5.4% |
| Immigrants | Northern Europe | 51.1 /100 | #173 | Average 5.4% |
| Potawatomi | 50.0 /100 | #174 | Average 5.4% |
| Immigrants | Iran | 49.0 /100 | #175 | Average 5.4% |
Demographics Similar to Irish by Unemployment Among Ages 65 to 74 years
In terms of unemployment among ages 65 to 74 years, the demographic groups most similar to Irish are Canadian (5.3%, a difference of 0.010%), Immigrants from Latvia (5.3%, a difference of 0.010%), Immigrants from Sri Lanka (5.3%, a difference of 0.040%), Turkish (5.3%, a difference of 0.060%), and New Zealander (5.3%, a difference of 0.060%).
| Demographics | Rating | Rank | Unemployment Among Ages 65 to 74 years |
| Finns | 79.0 /100 | #139 | Good 5.3% |
| Immigrants | Laos | 78.6 /100 | #140 | Good 5.3% |
| Immigrants | Asia | 78.4 /100 | #141 | Good 5.3% |
| Turks | 76.2 /100 | #142 | Good 5.3% |
| New Zealanders | 76.1 /100 | #143 | Good 5.3% |
| Immigrants | Chile | 76.0 /100 | #144 | Good 5.3% |
| Canadians | 75.0 /100 | #145 | Good 5.3% |
| Irish | 74.8 /100 | #146 | Good 5.3% |
| Immigrants | Latvia | 74.6 /100 | #147 | Good 5.3% |
| Immigrants | Sri Lanka | 73.8 /100 | #148 | Good 5.3% |
| Immigrants | Romania | 73.5 /100 | #149 | Good 5.3% |
| Immigrants | Poland | 73.2 /100 | #150 | Good 5.3% |
| Immigrants | Indonesia | 72.9 /100 | #151 | Good 5.3% |
| Spanish | 72.6 /100 | #152 | Good 5.3% |
| Immigrants | Cabo Verde | 72.5 /100 | #153 | Good 5.3% |