White/Caucasian vs Irish Family Households with Children
COMPARE
White/Caucasian
Irish
Family Households with Children
Family Households with Children Comparison
Whites/Caucasians
Irish
27.4%
FAMILY HOUSEHOLDS WITH CHILDREN
50.0/ 100
METRIC RATING
174th/ 347
METRIC RANK
26.8%
FAMILY HOUSEHOLDS WITH CHILDREN
1.8/ 100
METRIC RATING
252nd/ 347
METRIC RANK
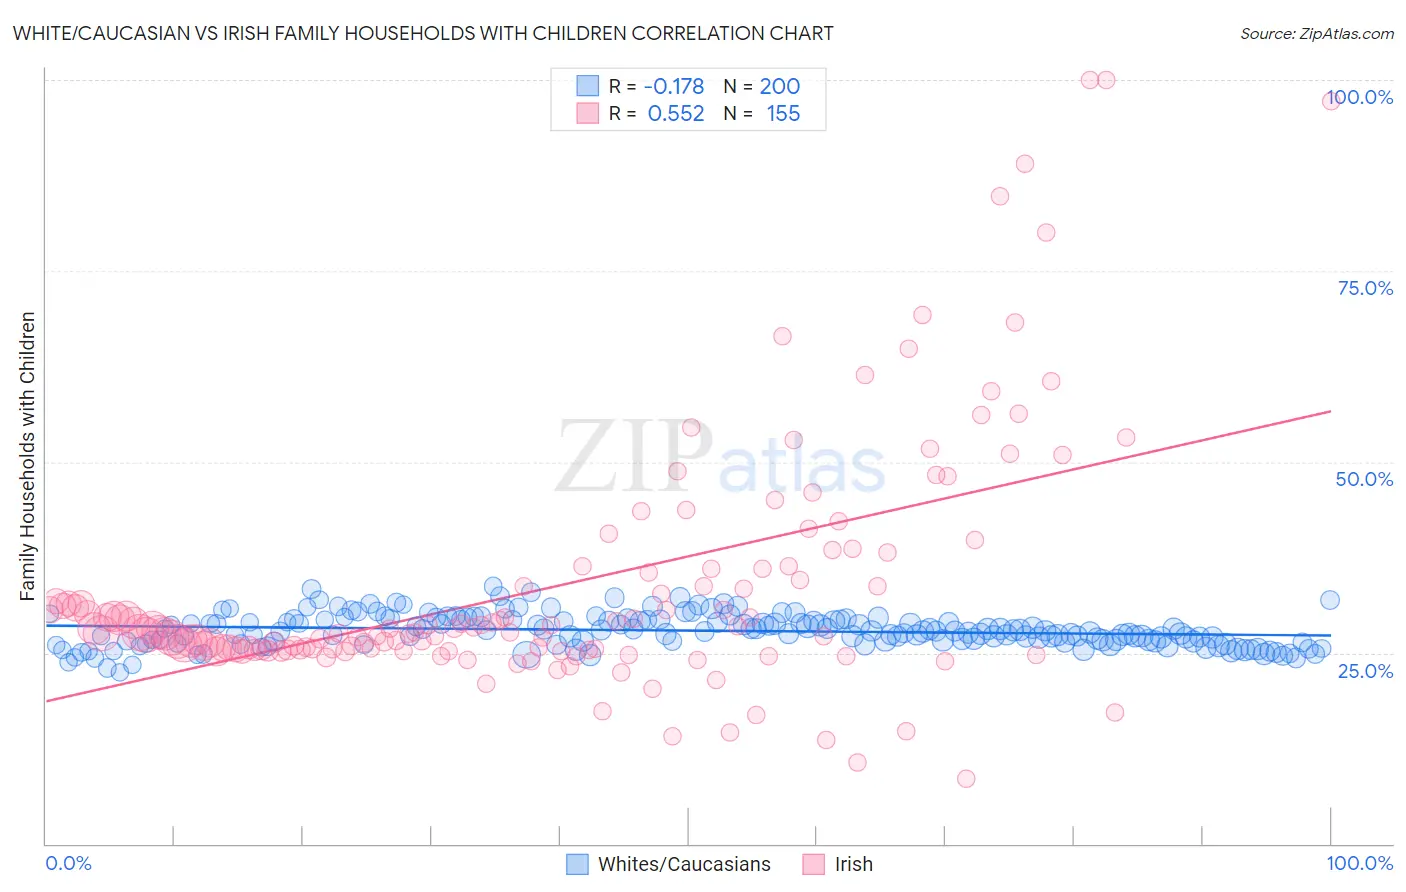
White/Caucasian vs Irish Family Households with Children Correlation Chart
The statistical analysis conducted on geographies consisting of 583,762,337 people shows a poor negative correlation between the proportion of Whites/Caucasians and percentage of family households with children in the United States with a correlation coefficient (R) of -0.178 and weighted average of 27.4%. Similarly, the statistical analysis conducted on geographies consisting of 579,410,491 people shows a substantial positive correlation between the proportion of Irish and percentage of family households with children in the United States with a correlation coefficient (R) of 0.552 and weighted average of 26.8%, a difference of 2.3%.
Family Households with Children Correlation Summary
| Measurement | White/Caucasian | Irish |
| Minimum | 22.4% | 8.5% |
| Maximum | 33.7% | 100.0% |
| Range | 11.3% | 91.5% |
| Mean | 27.9% | 33.6% |
| Median | 27.8% | 27.6% |
| Interquartile 25% (IQ1) | 26.5% | 25.4% |
| Interquartile 75% (IQ3) | 29.3% | 36.0% |
| Interquartile Range (IQR) | 2.8% | 10.5% |
| Standard Deviation (Sample) | 2.1% | 16.3% |
| Standard Deviation (Population) | 2.1% | 16.2% |
Similar Demographics by Family Households with Children
Demographics Similar to Whites/Caucasians by Family Households with Children
In terms of family households with children, the demographic groups most similar to Whites/Caucasians are British (27.4%, a difference of 0.0%), Immigrants from China (27.4%, a difference of 0.010%), Ugandan (27.4%, a difference of 0.020%), Spanish American (27.4%, a difference of 0.020%), and Immigrants from Argentina (27.5%, a difference of 0.050%).
| Demographics | Rating | Rank | Family Households with Children |
| Dominicans | 61.1 /100 | #167 | Good 27.5% |
| Immigrants | Kuwait | 60.9 /100 | #168 | Good 27.5% |
| Seminole | 56.9 /100 | #169 | Average 27.5% |
| Cherokee | 56.7 /100 | #170 | Average 27.5% |
| Blackfeet | 54.3 /100 | #171 | Average 27.5% |
| Israelis | 53.9 /100 | #172 | Average 27.5% |
| Immigrants | Argentina | 52.2 /100 | #173 | Average 27.5% |
| Whites/Caucasians | 50.0 /100 | #174 | Average 27.4% |
| British | 49.9 /100 | #175 | Average 27.4% |
| Immigrants | China | 49.6 /100 | #176 | Average 27.4% |
| Ugandans | 49.2 /100 | #177 | Average 27.4% |
| Spanish Americans | 48.9 /100 | #178 | Average 27.4% |
| Turks | 46.9 /100 | #179 | Average 27.4% |
| Immigrants | Turkey | 46.9 /100 | #180 | Average 27.4% |
| Aleuts | 46.7 /100 | #181 | Average 27.4% |
Demographics Similar to Irish by Family Households with Children
In terms of family households with children, the demographic groups most similar to Irish are Immigrants from Bosnia and Herzegovina (26.8%, a difference of 0.030%), Italian (26.8%, a difference of 0.080%), Belgian (26.9%, a difference of 0.090%), Immigrants from Eastern Europe (26.9%, a difference of 0.10%), and Immigrants from Scotland (26.8%, a difference of 0.10%).
| Demographics | Rating | Rank | Family Households with Children |
| Australians | 2.8 /100 | #245 | Tragic 26.9% |
| Jamaicans | 2.5 /100 | #246 | Tragic 26.9% |
| Potawatomi | 2.2 /100 | #247 | Tragic 26.9% |
| Immigrants | Kazakhstan | 2.2 /100 | #248 | Tragic 26.9% |
| Immigrants | Eastern Europe | 2.1 /100 | #249 | Tragic 26.9% |
| Belgians | 2.1 /100 | #250 | Tragic 26.9% |
| Immigrants | Bosnia and Herzegovina | 1.9 /100 | #251 | Tragic 26.8% |
| Irish | 1.8 /100 | #252 | Tragic 26.8% |
| Italians | 1.5 /100 | #253 | Tragic 26.8% |
| Immigrants | Scotland | 1.5 /100 | #254 | Tragic 26.8% |
| German Russians | 1.5 /100 | #255 | Tragic 26.8% |
| Scotch-Irish | 1.4 /100 | #256 | Tragic 26.8% |
| Slavs | 1.3 /100 | #257 | Tragic 26.8% |
| Immigrants | Cuba | 1.3 /100 | #258 | Tragic 26.8% |
| Immigrants | Lithuania | 1.2 /100 | #259 | Tragic 26.8% |