White/Caucasian vs Argentinean Householder Income Under 25 years
COMPARE
White/Caucasian
Argentinean
Householder Income Under 25 years
Householder Income Under 25 years Comparison
Whites/Caucasians
Argentineans
$50,336
HOUSEHOLDER INCOME UNDER 25 YEARS
1.1/ 100
METRIC RATING
258th/ 347
METRIC RANK
$54,154
HOUSEHOLDER INCOME UNDER 25 YEARS
99.2/ 100
METRIC RATING
96th/ 347
METRIC RANK
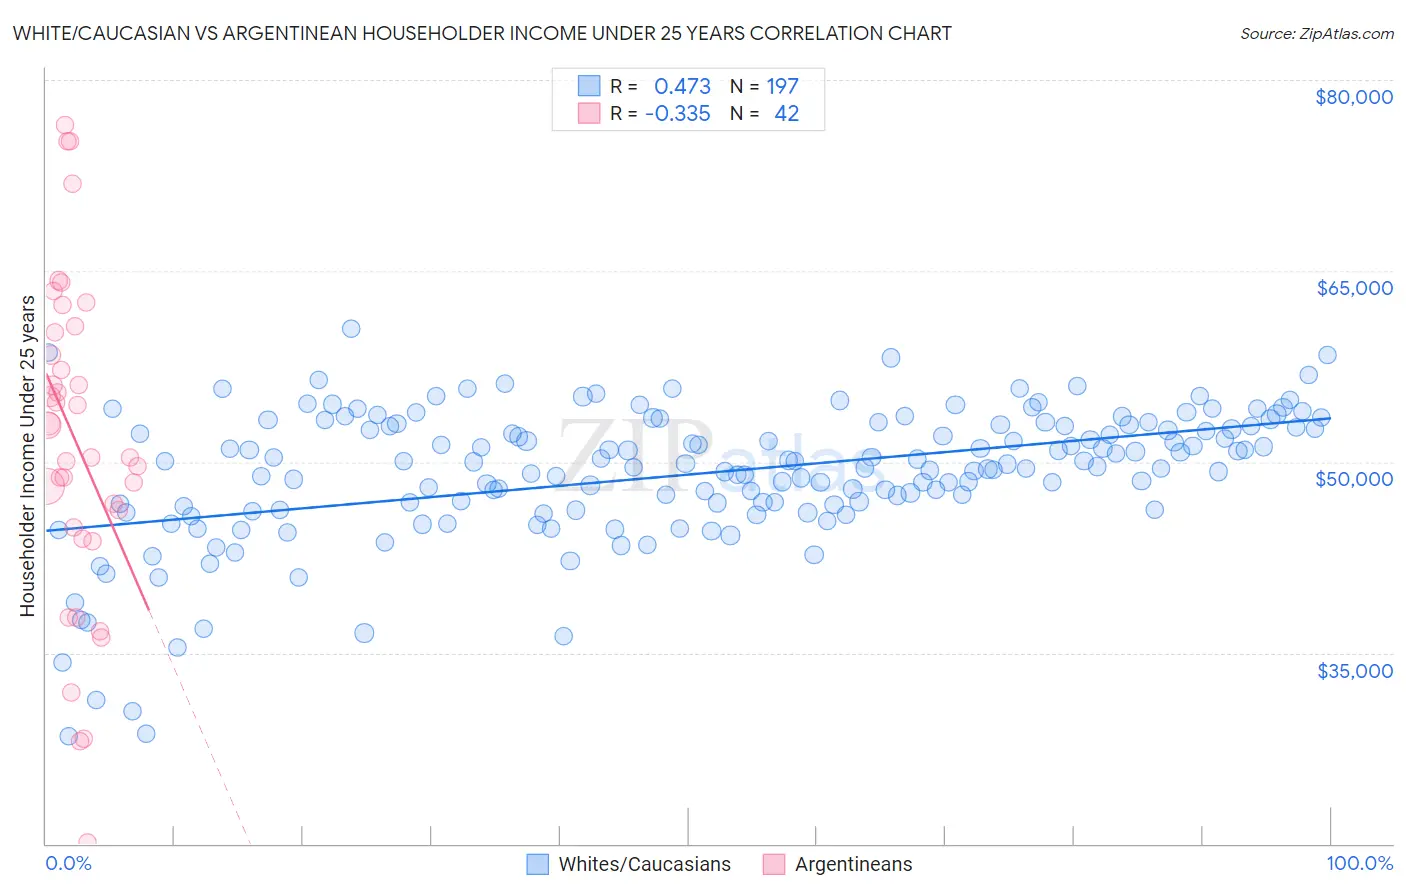
White/Caucasian vs Argentinean Householder Income Under 25 years Correlation Chart
The statistical analysis conducted on geographies consisting of 438,814,939 people shows a moderate positive correlation between the proportion of Whites/Caucasians and household income with householder under the age of 25 in the United States with a correlation coefficient (R) of 0.473 and weighted average of $50,336. Similarly, the statistical analysis conducted on geographies consisting of 257,126,127 people shows a mild negative correlation between the proportion of Argentineans and household income with householder under the age of 25 in the United States with a correlation coefficient (R) of -0.335 and weighted average of $54,154, a difference of 7.6%.
Householder Income Under 25 years Correlation Summary
| Measurement | White/Caucasian | Argentinean |
| Minimum | $28,432 | $20,094 |
| Maximum | $60,456 | $76,444 |
| Range | $32,024 | $56,350 |
| Mean | $49,043 | $51,569 |
| Median | $49,887 | $51,595 |
| Interquartile 25% (IQ1) | $46,371 | $44,853 |
| Interquartile 75% (IQ3) | $52,865 | $60,142 |
| Interquartile Range (IQR) | $6,494 | $15,290 |
| Standard Deviation (Sample) | $5,415 | $12,822 |
| Standard Deviation (Population) | $5,401 | $12,668 |
Similar Demographics by Householder Income Under 25 years
Demographics Similar to Whites/Caucasians by Householder Income Under 25 years
In terms of householder income under 25 years, the demographic groups most similar to Whites/Caucasians are Lebanese ($50,355, a difference of 0.040%), Immigrants from Dominica ($50,301, a difference of 0.070%), Aleut ($50,377, a difference of 0.080%), Immigrants from Cuba ($50,374, a difference of 0.080%), and Luxembourger ($50,379, a difference of 0.090%).
| Demographics | Rating | Rank | Householder Income Under 25 years |
| Celtics | 1.4 /100 | #251 | Tragic $50,447 |
| Immigrants | Mexico | 1.3 /100 | #252 | Tragic $50,422 |
| Immigrants | Haiti | 1.2 /100 | #253 | Tragic $50,398 |
| Luxembourgers | 1.2 /100 | #254 | Tragic $50,379 |
| Aleuts | 1.2 /100 | #255 | Tragic $50,377 |
| Immigrants | Cuba | 1.2 /100 | #256 | Tragic $50,374 |
| Lebanese | 1.1 /100 | #257 | Tragic $50,355 |
| Whites/Caucasians | 1.1 /100 | #258 | Tragic $50,336 |
| Immigrants | Dominica | 1.0 /100 | #259 | Tragic $50,301 |
| Hispanics or Latinos | 0.9 /100 | #260 | Tragic $50,279 |
| Hungarians | 0.9 /100 | #261 | Tragic $50,247 |
| Haitians | 0.8 /100 | #262 | Tragic $50,231 |
| Immigrants | Dominican Republic | 0.8 /100 | #263 | Tragic $50,204 |
| Fijians | 0.6 /100 | #264 | Tragic $50,132 |
| Belgians | 0.6 /100 | #265 | Tragic $50,113 |
Demographics Similar to Argentineans by Householder Income Under 25 years
In terms of householder income under 25 years, the demographic groups most similar to Argentineans are Immigrants from Malaysia ($54,179, a difference of 0.050%), Immigrants from Sierra Leone ($54,190, a difference of 0.070%), Immigrants from Portugal ($54,105, a difference of 0.090%), Immigrants from Argentina ($54,209, a difference of 0.10%), and Immigrants from St. Vincent and the Grenadines ($54,230, a difference of 0.14%).
| Demographics | Rating | Rank | Householder Income Under 25 years |
| Immigrants | South America | 99.4 /100 | #89 | Exceptional $54,268 |
| Turks | 99.4 /100 | #90 | Exceptional $54,266 |
| Immigrants | Egypt | 99.3 /100 | #91 | Exceptional $54,239 |
| Immigrants | St. Vincent and the Grenadines | 99.3 /100 | #92 | Exceptional $54,230 |
| Immigrants | Argentina | 99.3 /100 | #93 | Exceptional $54,209 |
| Immigrants | Sierra Leone | 99.3 /100 | #94 | Exceptional $54,190 |
| Immigrants | Malaysia | 99.2 /100 | #95 | Exceptional $54,179 |
| Argentineans | 99.2 /100 | #96 | Exceptional $54,154 |
| Immigrants | Portugal | 99.1 /100 | #97 | Exceptional $54,105 |
| Eastern Europeans | 99.0 /100 | #98 | Exceptional $54,066 |
| Alaska Natives | 98.8 /100 | #99 | Exceptional $54,000 |
| Immigrants | Kazakhstan | 98.8 /100 | #100 | Exceptional $53,990 |
| South Americans | 98.6 /100 | #101 | Exceptional $53,939 |
| Ecuadorians | 98.5 /100 | #102 | Exceptional $53,911 |
| Ukrainians | 98.3 /100 | #103 | Exceptional $53,843 |