West Indian vs Immigrants from Russia Wage/Income Gap
COMPARE
West Indian
Immigrants from Russia
Wage/Income Gap
Wage/Income Gap Comparison
West Indians
Immigrants from Russia
19.6%
WAGE/INCOME GAP
100.0/ 100
METRIC RATING
15th/ 347
METRIC RANK
26.4%
WAGE/INCOME GAP
19.0/ 100
METRIC RATING
204th/ 347
METRIC RANK
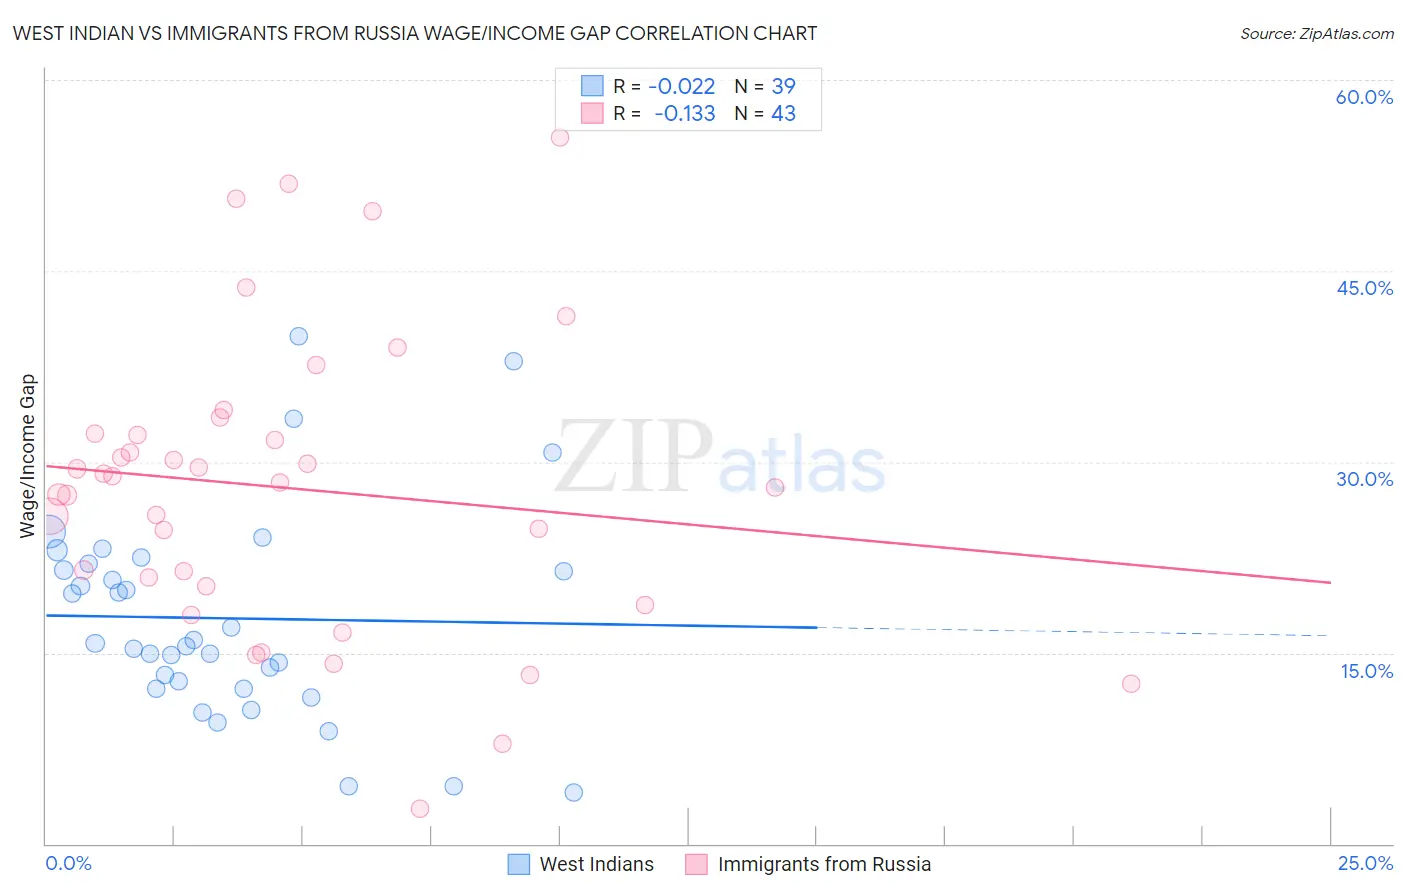
West Indian vs Immigrants from Russia Wage/Income Gap Correlation Chart
The statistical analysis conducted on geographies consisting of 253,957,443 people shows no correlation between the proportion of West Indians and wage/income gap percentage in the United States with a correlation coefficient (R) of -0.022 and weighted average of 19.6%. Similarly, the statistical analysis conducted on geographies consisting of 347,771,483 people shows a poor negative correlation between the proportion of Immigrants from Russia and wage/income gap percentage in the United States with a correlation coefficient (R) of -0.133 and weighted average of 26.4%, a difference of 34.8%.
Wage/Income Gap Correlation Summary
| Measurement | West Indian | Immigrants from Russia |
| Minimum | 4.0% | 2.8% |
| Maximum | 39.8% | 55.5% |
| Range | 35.8% | 52.7% |
| Mean | 17.7% | 27.9% |
| Median | 15.7% | 28.3% |
| Interquartile 25% (IQ1) | 12.2% | 20.2% |
| Interquartile 75% (IQ3) | 22.0% | 32.2% |
| Interquartile Range (IQR) | 9.8% | 12.0% |
| Standard Deviation (Sample) | 8.2% | 11.6% |
| Standard Deviation (Population) | 8.1% | 11.5% |
Similar Demographics by Wage/Income Gap
Demographics Similar to West Indians by Wage/Income Gap
In terms of wage/income gap, the demographic groups most similar to West Indians are Jamaican (19.6%, a difference of 0.12%), Haitian (19.7%, a difference of 0.91%), Immigrants from Trinidad and Tobago (19.3%, a difference of 1.2%), Trinidadian and Tobagonian (19.3%, a difference of 1.2%), and Immigrants from West Indies (19.2%, a difference of 1.7%).
| Demographics | Rating | Rank | Wage/Income Gap |
| Immigrants | Jamaica | 100.0 /100 | #8 | Exceptional 18.8% |
| Barbadians | 100.0 /100 | #9 | Exceptional 19.0% |
| Crow | 100.0 /100 | #10 | Exceptional 19.1% |
| Immigrants | Haiti | 100.0 /100 | #11 | Exceptional 19.2% |
| Immigrants | West Indies | 100.0 /100 | #12 | Exceptional 19.2% |
| Trinidadians and Tobagonians | 100.0 /100 | #13 | Exceptional 19.3% |
| Immigrants | Trinidad and Tobago | 100.0 /100 | #14 | Exceptional 19.3% |
| West Indians | 100.0 /100 | #15 | Exceptional 19.6% |
| Jamaicans | 100.0 /100 | #16 | Exceptional 19.6% |
| Haitians | 100.0 /100 | #17 | Exceptional 19.7% |
| Hopi | 100.0 /100 | #18 | Exceptional 20.0% |
| Immigrants | Dominica | 100.0 /100 | #19 | Exceptional 20.0% |
| Bahamians | 100.0 /100 | #20 | Exceptional 20.2% |
| Immigrants | Caribbean | 100.0 /100 | #21 | Exceptional 20.4% |
| Immigrants | Liberia | 100.0 /100 | #22 | Exceptional 20.6% |
Demographics Similar to Immigrants from Russia by Wage/Income Gap
In terms of wage/income gap, the demographic groups most similar to Immigrants from Russia are Laotian (26.4%, a difference of 0.020%), Immigrants from Eastern Europe (26.4%, a difference of 0.020%), Immigrants from Syria (26.4%, a difference of 0.030%), Immigrants from Southern Europe (26.4%, a difference of 0.18%), and Delaware (26.3%, a difference of 0.19%).
| Demographics | Rating | Rank | Wage/Income Gap |
| Zimbabweans | 21.6 /100 | #197 | Fair 26.3% |
| Venezuelans | 21.5 /100 | #198 | Fair 26.3% |
| Dutch West Indians | 21.0 /100 | #199 | Fair 26.3% |
| Delaware | 20.9 /100 | #200 | Fair 26.3% |
| Immigrants | Syria | 19.3 /100 | #201 | Poor 26.4% |
| Laotians | 19.2 /100 | #202 | Poor 26.4% |
| Immigrants | Eastern Europe | 19.2 /100 | #203 | Poor 26.4% |
| Immigrants | Russia | 19.0 /100 | #204 | Poor 26.4% |
| Immigrants | Southern Europe | 17.3 /100 | #205 | Poor 26.4% |
| Indians (Asian) | 16.5 /100 | #206 | Poor 26.4% |
| Immigrants | Italy | 15.8 /100 | #207 | Poor 26.5% |
| Egyptians | 12.7 /100 | #208 | Poor 26.6% |
| Immigrants | Kuwait | 12.6 /100 | #209 | Poor 26.6% |
| Arabs | 12.3 /100 | #210 | Poor 26.6% |
| Mongolians | 11.4 /100 | #211 | Poor 26.6% |