Vietnamese vs Immigrants from Latvia Median Household Income
COMPARE
Vietnamese
Immigrants from Latvia
Median Household Income
Median Household Income Comparison
Vietnamese
Immigrants from Latvia
$82,248
MEDIAN HOUSEHOLD INCOME
13.8/ 100
METRIC RATING
215th/ 347
METRIC RANK
$93,602
MEDIAN HOUSEHOLD INCOME
99.6/ 100
METRIC RATING
74th/ 347
METRIC RANK
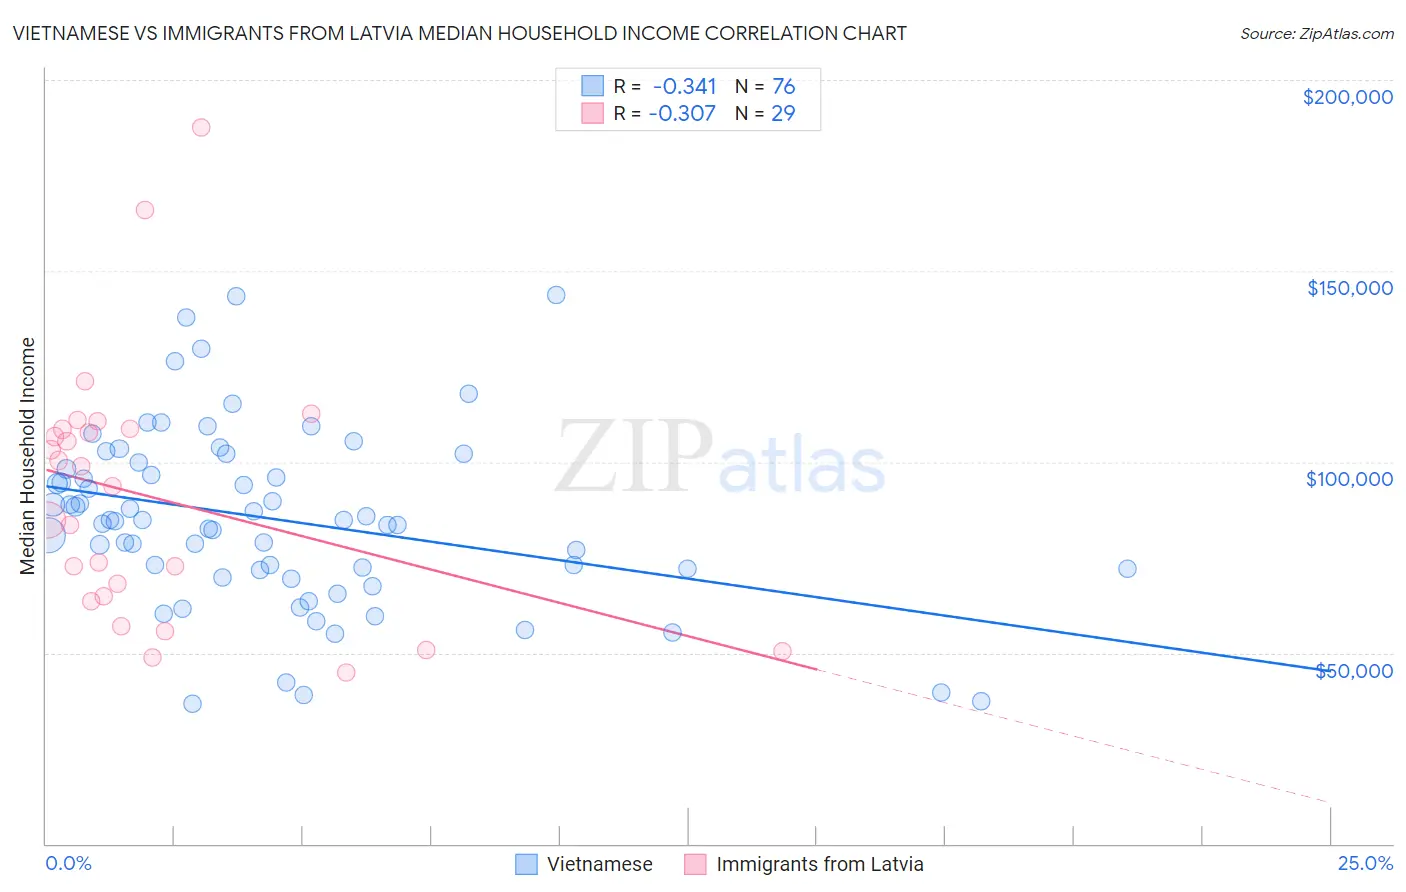
Vietnamese vs Immigrants from Latvia Median Household Income Correlation Chart
The statistical analysis conducted on geographies consisting of 170,624,806 people shows a mild negative correlation between the proportion of Vietnamese and median household income in the United States with a correlation coefficient (R) of -0.341 and weighted average of $82,248. Similarly, the statistical analysis conducted on geographies consisting of 113,726,313 people shows a mild negative correlation between the proportion of Immigrants from Latvia and median household income in the United States with a correlation coefficient (R) of -0.307 and weighted average of $93,602, a difference of 13.8%.
Median Household Income Correlation Summary
| Measurement | Vietnamese | Immigrants from Latvia |
| Minimum | $36,578 | $44,737 |
| Maximum | $143,859 | $187,593 |
| Range | $107,281 | $142,856 |
| Mean | $84,974 | $90,790 |
| Median | $84,533 | $93,558 |
| Interquartile 25% (IQ1) | $71,810 | $64,215 |
| Interquartile 75% (IQ3) | $98,943 | $108,638 |
| Interquartile Range (IQR) | $27,134 | $44,423 |
| Standard Deviation (Sample) | $23,335 | $33,495 |
| Standard Deviation (Population) | $23,181 | $32,912 |
Similar Demographics by Median Household Income
Demographics Similar to Vietnamese by Median Household Income
In terms of median household income, the demographic groups most similar to Vietnamese are Panamanian ($82,272, a difference of 0.030%), Yugoslavian ($82,186, a difference of 0.070%), Nepalese ($82,410, a difference of 0.20%), Venezuelan ($82,432, a difference of 0.22%), and Ecuadorian ($82,070, a difference of 0.22%).
| Demographics | Rating | Rank | Median Household Income |
| French Canadians | 18.7 /100 | #208 | Poor $82,810 |
| Immigrants | Iraq | 16.7 /100 | #209 | Poor $82,594 |
| Immigrants | Uruguay | 16.4 /100 | #210 | Poor $82,560 |
| Salvadorans | 15.4 /100 | #211 | Poor $82,449 |
| Venezuelans | 15.3 /100 | #212 | Poor $82,432 |
| Nepalese | 15.1 /100 | #213 | Poor $82,410 |
| Panamanians | 14.0 /100 | #214 | Poor $82,272 |
| Vietnamese | 13.8 /100 | #215 | Poor $82,248 |
| Yugoslavians | 13.3 /100 | #216 | Poor $82,186 |
| Ecuadorians | 12.5 /100 | #217 | Poor $82,070 |
| Whites/Caucasians | 12.2 /100 | #218 | Poor $82,029 |
| Nigerians | 10.3 /100 | #219 | Poor $81,725 |
| Immigrants | Venezuela | 9.0 /100 | #220 | Tragic $81,506 |
| Immigrants | Ghana | 9.0 /100 | #221 | Tragic $81,489 |
| Immigrants | Nigeria | 7.7 /100 | #222 | Tragic $81,236 |
Demographics Similar to Immigrants from Latvia by Median Household Income
In terms of median household income, the demographic groups most similar to Immigrants from Latvia are Immigrants from Egypt ($93,700, a difference of 0.10%), Immigrants from Italy ($93,465, a difference of 0.15%), South African ($93,379, a difference of 0.24%), Immigrants from Afghanistan ($93,375, a difference of 0.24%), and Lithuanian ($93,852, a difference of 0.27%).
| Demographics | Rating | Rank | Median Household Income |
| Immigrants | Scotland | 99.7 /100 | #67 | Exceptional $94,091 |
| Mongolians | 99.7 /100 | #68 | Exceptional $93,971 |
| Argentineans | 99.7 /100 | #69 | Exceptional $93,960 |
| Immigrants | Fiji | 99.7 /100 | #70 | Exceptional $93,933 |
| Immigrants | Philippines | 99.6 /100 | #71 | Exceptional $93,899 |
| Lithuanians | 99.6 /100 | #72 | Exceptional $93,852 |
| Immigrants | Egypt | 99.6 /100 | #73 | Exceptional $93,700 |
| Immigrants | Latvia | 99.6 /100 | #74 | Exceptional $93,602 |
| Immigrants | Italy | 99.5 /100 | #75 | Exceptional $93,465 |
| South Africans | 99.5 /100 | #76 | Exceptional $93,379 |
| Immigrants | Afghanistan | 99.5 /100 | #77 | Exceptional $93,375 |
| Immigrants | Bulgaria | 99.4 /100 | #78 | Exceptional $93,148 |
| Sri Lankans | 99.4 /100 | #79 | Exceptional $93,093 |
| Tongans | 99.4 /100 | #80 | Exceptional $93,076 |
| Immigrants | Eastern Europe | 99.4 /100 | #81 | Exceptional $93,051 |