Vietnamese vs Burmese Median Household Income
COMPARE
Vietnamese
Burmese
Median Household Income
Median Household Income Comparison
Vietnamese
Burmese
$82,248
MEDIAN HOUSEHOLD INCOME
13.8/ 100
METRIC RATING
215th/ 347
METRIC RANK
$103,145
MEDIAN HOUSEHOLD INCOME
100.0/ 100
METRIC RATING
16th/ 347
METRIC RANK
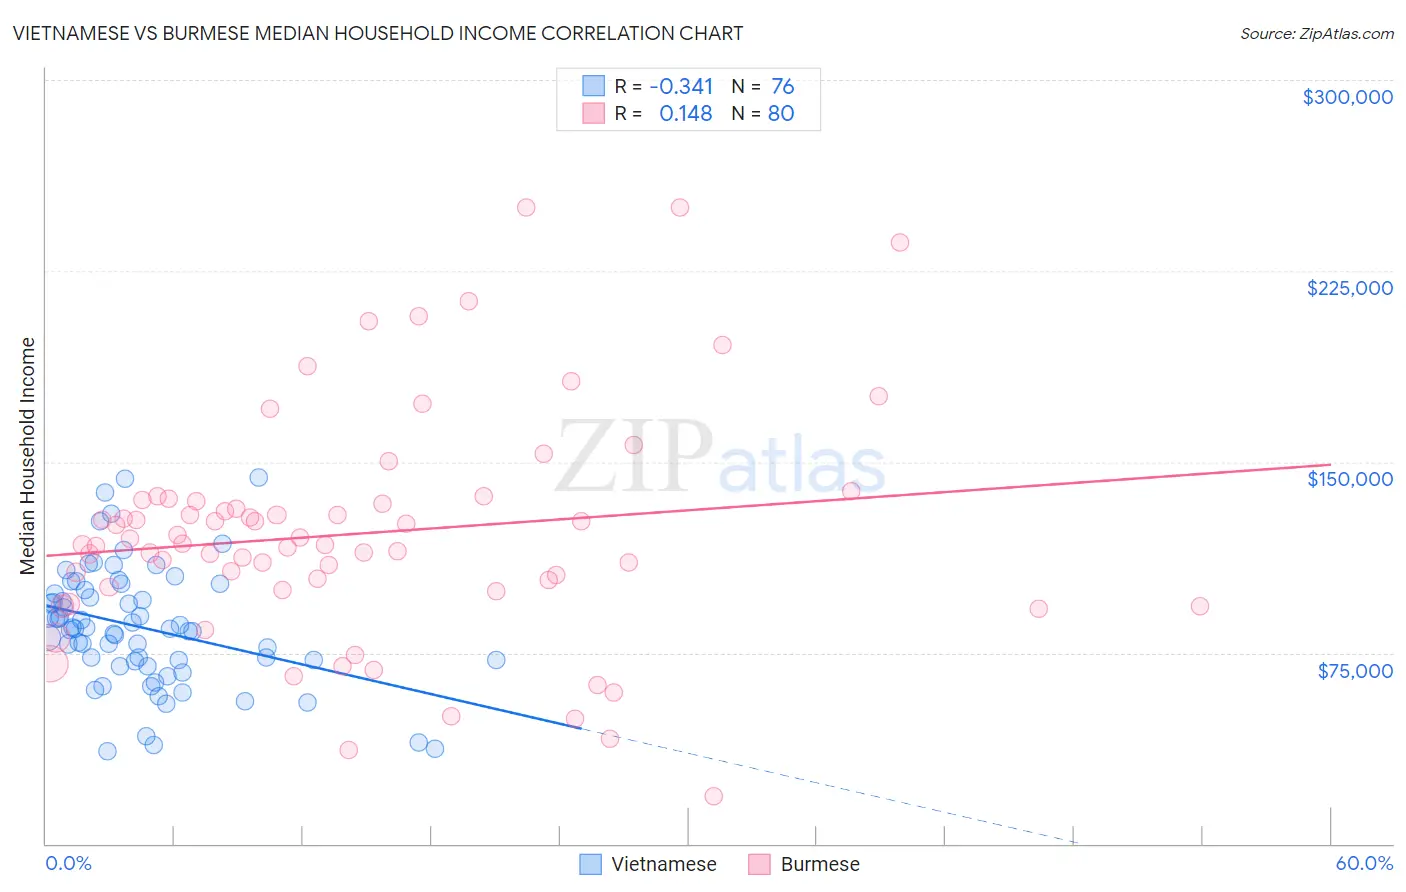
Vietnamese vs Burmese Median Household Income Correlation Chart
The statistical analysis conducted on geographies consisting of 170,624,806 people shows a mild negative correlation between the proportion of Vietnamese and median household income in the United States with a correlation coefficient (R) of -0.341 and weighted average of $82,248. Similarly, the statistical analysis conducted on geographies consisting of 464,741,598 people shows a poor positive correlation between the proportion of Burmese and median household income in the United States with a correlation coefficient (R) of 0.148 and weighted average of $103,145, a difference of 25.4%.
Median Household Income Correlation Summary
| Measurement | Vietnamese | Burmese |
| Minimum | $36,578 | $18,739 |
| Maximum | $143,859 | $250,001 |
| Range | $107,281 | $231,262 |
| Mean | $84,974 | $121,887 |
| Median | $84,533 | $117,660 |
| Interquartile 25% (IQ1) | $71,810 | $100,120 |
| Interquartile 75% (IQ3) | $98,943 | $134,790 |
| Interquartile Range (IQR) | $27,134 | $34,670 |
| Standard Deviation (Sample) | $23,335 | $45,107 |
| Standard Deviation (Population) | $23,181 | $44,824 |
Similar Demographics by Median Household Income
Demographics Similar to Vietnamese by Median Household Income
In terms of median household income, the demographic groups most similar to Vietnamese are Panamanian ($82,272, a difference of 0.030%), Yugoslavian ($82,186, a difference of 0.070%), Nepalese ($82,410, a difference of 0.20%), Venezuelan ($82,432, a difference of 0.22%), and Ecuadorian ($82,070, a difference of 0.22%).
| Demographics | Rating | Rank | Median Household Income |
| French Canadians | 18.7 /100 | #208 | Poor $82,810 |
| Immigrants | Iraq | 16.7 /100 | #209 | Poor $82,594 |
| Immigrants | Uruguay | 16.4 /100 | #210 | Poor $82,560 |
| Salvadorans | 15.4 /100 | #211 | Poor $82,449 |
| Venezuelans | 15.3 /100 | #212 | Poor $82,432 |
| Nepalese | 15.1 /100 | #213 | Poor $82,410 |
| Panamanians | 14.0 /100 | #214 | Poor $82,272 |
| Vietnamese | 13.8 /100 | #215 | Poor $82,248 |
| Yugoslavians | 13.3 /100 | #216 | Poor $82,186 |
| Ecuadorians | 12.5 /100 | #217 | Poor $82,070 |
| Whites/Caucasians | 12.2 /100 | #218 | Poor $82,029 |
| Nigerians | 10.3 /100 | #219 | Poor $81,725 |
| Immigrants | Venezuela | 9.0 /100 | #220 | Tragic $81,506 |
| Immigrants | Ghana | 9.0 /100 | #221 | Tragic $81,489 |
| Immigrants | Nigeria | 7.7 /100 | #222 | Tragic $81,236 |
Demographics Similar to Burmese by Median Household Income
In terms of median household income, the demographic groups most similar to Burmese are Immigrants from Korea ($102,962, a difference of 0.18%), Cypriot ($102,843, a difference of 0.29%), Immigrants from Australia ($102,562, a difference of 0.57%), Immigrants from Israel ($104,090, a difference of 0.92%), and Bolivian ($102,195, a difference of 0.93%).
| Demographics | Rating | Rank | Median Household Income |
| Okinawans | 100.0 /100 | #9 | Exceptional $106,624 |
| Immigrants | South Central Asia | 100.0 /100 | #10 | Exceptional $106,057 |
| Immigrants | China | 100.0 /100 | #11 | Exceptional $105,335 |
| Indians (Asian) | 100.0 /100 | #12 | Exceptional $105,262 |
| Immigrants | Eastern Asia | 100.0 /100 | #13 | Exceptional $104,796 |
| Immigrants | Ireland | 100.0 /100 | #14 | Exceptional $104,692 |
| Immigrants | Israel | 100.0 /100 | #15 | Exceptional $104,090 |
| Burmese | 100.0 /100 | #16 | Exceptional $103,145 |
| Immigrants | Korea | 100.0 /100 | #17 | Exceptional $102,962 |
| Cypriots | 100.0 /100 | #18 | Exceptional $102,843 |
| Immigrants | Australia | 100.0 /100 | #19 | Exceptional $102,562 |
| Bolivians | 100.0 /100 | #20 | Exceptional $102,195 |
| Eastern Europeans | 100.0 /100 | #21 | Exceptional $101,781 |
| Asians | 100.0 /100 | #22 | Exceptional $101,681 |
| Immigrants | Bolivia | 100.0 /100 | #23 | Exceptional $101,394 |