Vietnamese vs Immigrants from Kazakhstan Median Household Income
COMPARE
Vietnamese
Immigrants from Kazakhstan
Median Household Income
Median Household Income Comparison
Vietnamese
Immigrants from Kazakhstan
$82,248
MEDIAN HOUSEHOLD INCOME
13.8/ 100
METRIC RATING
215th/ 347
METRIC RANK
$91,015
MEDIAN HOUSEHOLD INCOME
97.8/ 100
METRIC RATING
104th/ 347
METRIC RANK
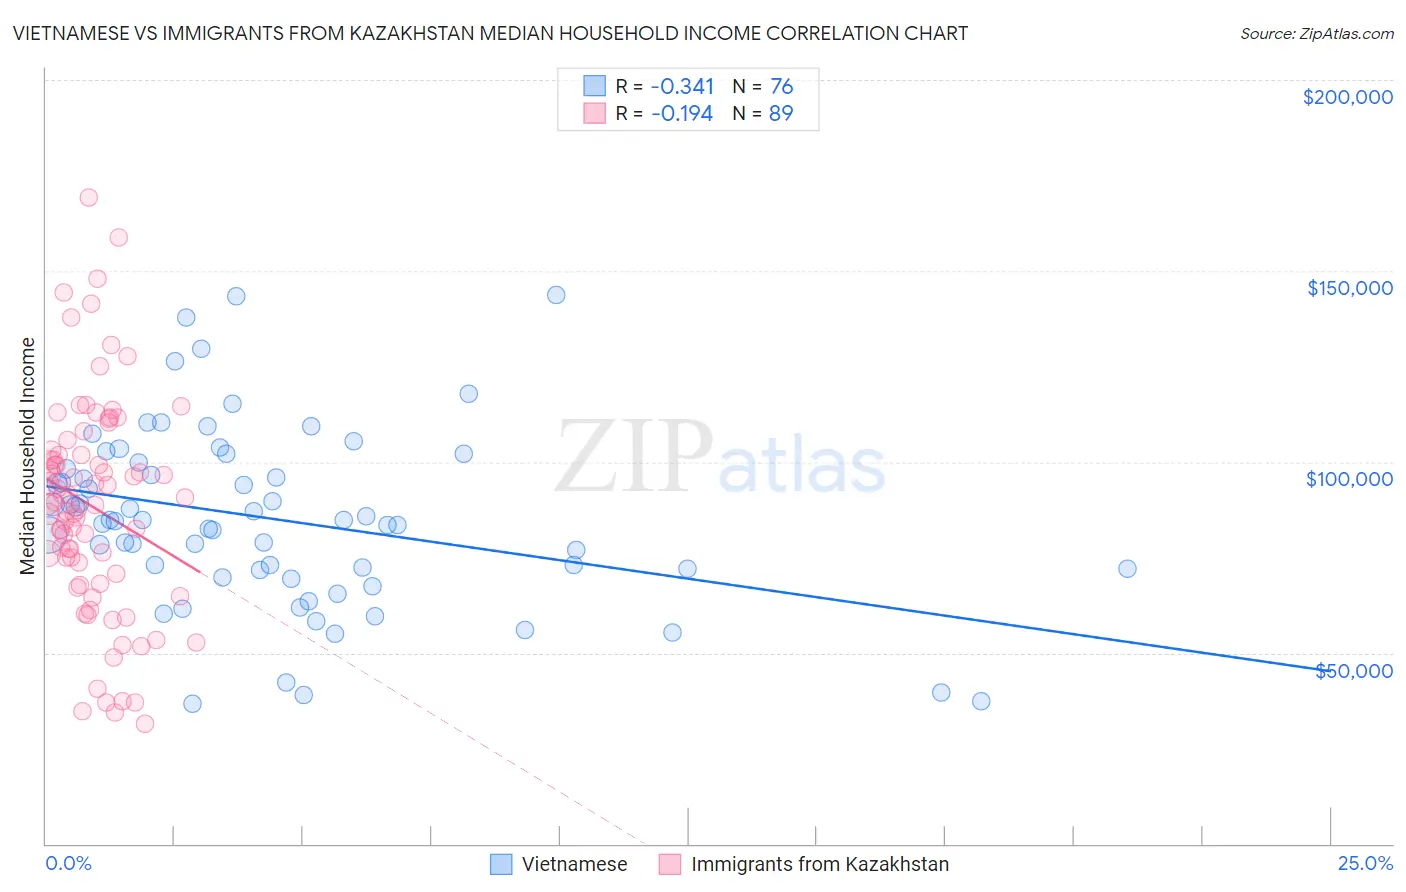
Vietnamese vs Immigrants from Kazakhstan Median Household Income Correlation Chart
The statistical analysis conducted on geographies consisting of 170,624,806 people shows a mild negative correlation between the proportion of Vietnamese and median household income in the United States with a correlation coefficient (R) of -0.341 and weighted average of $82,248. Similarly, the statistical analysis conducted on geographies consisting of 124,425,311 people shows a poor negative correlation between the proportion of Immigrants from Kazakhstan and median household income in the United States with a correlation coefficient (R) of -0.194 and weighted average of $91,015, a difference of 10.7%.
Median Household Income Correlation Summary
| Measurement | Vietnamese | Immigrants from Kazakhstan |
| Minimum | $36,578 | $31,369 |
| Maximum | $143,859 | $169,141 |
| Range | $107,281 | $137,772 |
| Mean | $84,974 | $88,237 |
| Median | $84,533 | $88,972 |
| Interquartile 25% (IQ1) | $71,810 | $69,524 |
| Interquartile 75% (IQ3) | $98,943 | $102,378 |
| Interquartile Range (IQR) | $27,134 | $32,854 |
| Standard Deviation (Sample) | $23,335 | $28,398 |
| Standard Deviation (Population) | $23,181 | $28,238 |
Similar Demographics by Median Household Income
Demographics Similar to Vietnamese by Median Household Income
In terms of median household income, the demographic groups most similar to Vietnamese are Panamanian ($82,272, a difference of 0.030%), Yugoslavian ($82,186, a difference of 0.070%), Nepalese ($82,410, a difference of 0.20%), Venezuelan ($82,432, a difference of 0.22%), and Ecuadorian ($82,070, a difference of 0.22%).
| Demographics | Rating | Rank | Median Household Income |
| French Canadians | 18.7 /100 | #208 | Poor $82,810 |
| Immigrants | Iraq | 16.7 /100 | #209 | Poor $82,594 |
| Immigrants | Uruguay | 16.4 /100 | #210 | Poor $82,560 |
| Salvadorans | 15.4 /100 | #211 | Poor $82,449 |
| Venezuelans | 15.3 /100 | #212 | Poor $82,432 |
| Nepalese | 15.1 /100 | #213 | Poor $82,410 |
| Panamanians | 14.0 /100 | #214 | Poor $82,272 |
| Vietnamese | 13.8 /100 | #215 | Poor $82,248 |
| Yugoslavians | 13.3 /100 | #216 | Poor $82,186 |
| Ecuadorians | 12.5 /100 | #217 | Poor $82,070 |
| Whites/Caucasians | 12.2 /100 | #218 | Poor $82,029 |
| Nigerians | 10.3 /100 | #219 | Poor $81,725 |
| Immigrants | Venezuela | 9.0 /100 | #220 | Tragic $81,506 |
| Immigrants | Ghana | 9.0 /100 | #221 | Tragic $81,489 |
| Immigrants | Nigeria | 7.7 /100 | #222 | Tragic $81,236 |
Demographics Similar to Immigrants from Kazakhstan by Median Household Income
In terms of median household income, the demographic groups most similar to Immigrants from Kazakhstan are Immigrants from Ukraine ($91,124, a difference of 0.12%), Immigrants from Brazil ($90,907, a difference of 0.12%), Macedonian ($90,761, a difference of 0.28%), Austrian ($91,339, a difference of 0.36%), and Croatian ($90,685, a difference of 0.36%).
| Demographics | Rating | Rank | Median Household Income |
| Immigrants | Serbia | 98.6 /100 | #97 | Exceptional $91,730 |
| Immigrants | Southern Europe | 98.5 /100 | #98 | Exceptional $91,605 |
| Immigrants | South Eastern Asia | 98.4 /100 | #99 | Exceptional $91,541 |
| Ukrainians | 98.3 /100 | #100 | Exceptional $91,456 |
| Immigrants | Moldova | 98.3 /100 | #101 | Exceptional $91,446 |
| Austrians | 98.2 /100 | #102 | Exceptional $91,339 |
| Immigrants | Ukraine | 98.0 /100 | #103 | Exceptional $91,124 |
| Immigrants | Kazakhstan | 97.8 /100 | #104 | Exceptional $91,015 |
| Immigrants | Brazil | 97.7 /100 | #105 | Exceptional $90,907 |
| Macedonians | 97.4 /100 | #106 | Exceptional $90,761 |
| Croatians | 97.3 /100 | #107 | Exceptional $90,685 |
| Zimbabweans | 97.2 /100 | #108 | Exceptional $90,618 |
| Chileans | 97.2 /100 | #109 | Exceptional $90,605 |
| Palestinians | 97.1 /100 | #110 | Exceptional $90,574 |
| Immigrants | Poland | 97.1 /100 | #111 | Exceptional $90,549 |