Vietnamese vs Soviet Union Median Household Income
COMPARE
Vietnamese
Soviet Union
Median Household Income
Median Household Income Comparison
Vietnamese
Soviet Union
$82,248
MEDIAN HOUSEHOLD INCOME
13.8/ 100
METRIC RATING
215th/ 347
METRIC RANK
$95,098
MEDIAN HOUSEHOLD INCOME
99.8/ 100
METRIC RATING
58th/ 347
METRIC RANK
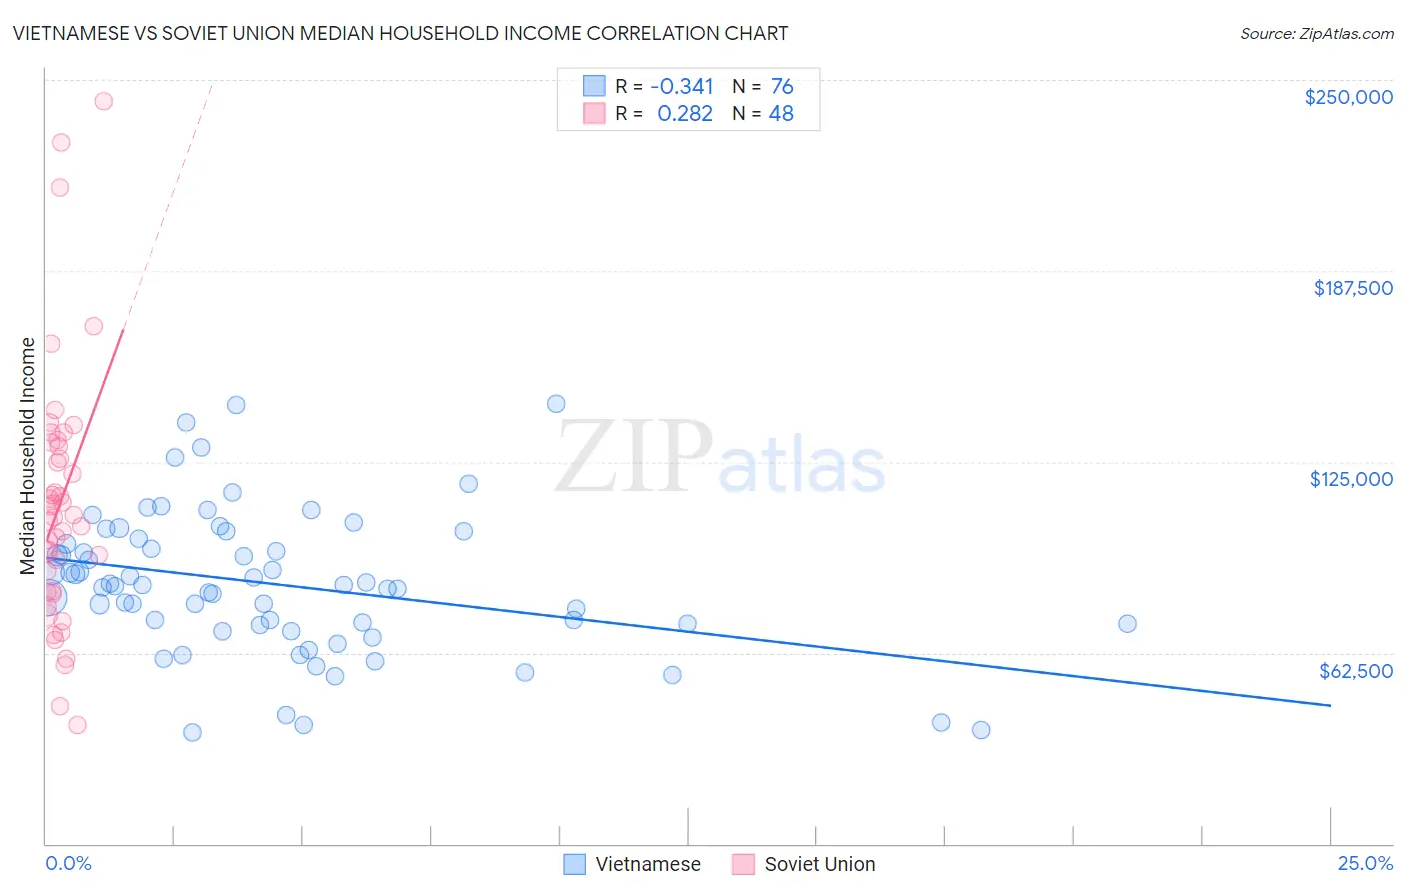
Vietnamese vs Soviet Union Median Household Income Correlation Chart
The statistical analysis conducted on geographies consisting of 170,624,806 people shows a mild negative correlation between the proportion of Vietnamese and median household income in the United States with a correlation coefficient (R) of -0.341 and weighted average of $82,248. Similarly, the statistical analysis conducted on geographies consisting of 43,509,359 people shows a weak positive correlation between the proportion of Soviet Union and median household income in the United States with a correlation coefficient (R) of 0.282 and weighted average of $95,098, a difference of 15.6%.
Median Household Income Correlation Summary
| Measurement | Vietnamese | Soviet Union |
| Minimum | $36,578 | $38,670 |
| Maximum | $143,859 | $243,125 |
| Range | $107,281 | $204,455 |
| Mean | $84,974 | $111,162 |
| Median | $84,533 | $107,165 |
| Interquartile 25% (IQ1) | $71,810 | $82,608 |
| Interquartile 75% (IQ3) | $98,943 | $130,577 |
| Interquartile Range (IQR) | $27,134 | $47,969 |
| Standard Deviation (Sample) | $23,335 | $41,880 |
| Standard Deviation (Population) | $23,181 | $41,441 |
Similar Demographics by Median Household Income
Demographics Similar to Vietnamese by Median Household Income
In terms of median household income, the demographic groups most similar to Vietnamese are Panamanian ($82,272, a difference of 0.030%), Yugoslavian ($82,186, a difference of 0.070%), Nepalese ($82,410, a difference of 0.20%), Venezuelan ($82,432, a difference of 0.22%), and Ecuadorian ($82,070, a difference of 0.22%).
| Demographics | Rating | Rank | Median Household Income |
| French Canadians | 18.7 /100 | #208 | Poor $82,810 |
| Immigrants | Iraq | 16.7 /100 | #209 | Poor $82,594 |
| Immigrants | Uruguay | 16.4 /100 | #210 | Poor $82,560 |
| Salvadorans | 15.4 /100 | #211 | Poor $82,449 |
| Venezuelans | 15.3 /100 | #212 | Poor $82,432 |
| Nepalese | 15.1 /100 | #213 | Poor $82,410 |
| Panamanians | 14.0 /100 | #214 | Poor $82,272 |
| Vietnamese | 13.8 /100 | #215 | Poor $82,248 |
| Yugoslavians | 13.3 /100 | #216 | Poor $82,186 |
| Ecuadorians | 12.5 /100 | #217 | Poor $82,070 |
| Whites/Caucasians | 12.2 /100 | #218 | Poor $82,029 |
| Nigerians | 10.3 /100 | #219 | Poor $81,725 |
| Immigrants | Venezuela | 9.0 /100 | #220 | Tragic $81,506 |
| Immigrants | Ghana | 9.0 /100 | #221 | Tragic $81,489 |
| Immigrants | Nigeria | 7.7 /100 | #222 | Tragic $81,236 |
Demographics Similar to Soviet Union by Median Household Income
In terms of median household income, the demographic groups most similar to Soviet Union are New Zealander ($95,146, a difference of 0.050%), Immigrants from Europe ($95,032, a difference of 0.070%), Korean ($95,018, a difference of 0.080%), Laotian ($94,990, a difference of 0.11%), and Immigrants from Austria ($95,277, a difference of 0.19%).
| Demographics | Rating | Rank | Median Household Income |
| Estonians | 99.9 /100 | #51 | Exceptional $95,930 |
| Immigrants | South Africa | 99.9 /100 | #52 | Exceptional $95,800 |
| Paraguayans | 99.9 /100 | #53 | Exceptional $95,737 |
| Egyptians | 99.9 /100 | #54 | Exceptional $95,673 |
| Immigrants | Czechoslovakia | 99.9 /100 | #55 | Exceptional $95,319 |
| Immigrants | Austria | 99.9 /100 | #56 | Exceptional $95,277 |
| New Zealanders | 99.8 /100 | #57 | Exceptional $95,146 |
| Soviet Union | 99.8 /100 | #58 | Exceptional $95,098 |
| Immigrants | Europe | 99.8 /100 | #59 | Exceptional $95,032 |
| Koreans | 99.8 /100 | #60 | Exceptional $95,018 |
| Laotians | 99.8 /100 | #61 | Exceptional $94,990 |
| Immigrants | Norway | 99.8 /100 | #62 | Exceptional $94,846 |
| Greeks | 99.8 /100 | #63 | Exceptional $94,735 |
| Immigrants | Netherlands | 99.7 /100 | #64 | Exceptional $94,411 |
| Immigrants | Belarus | 99.7 /100 | #65 | Exceptional $94,399 |