Italian vs Immigrants from Latvia Median Household Income
COMPARE
Italian
Immigrants from Latvia
Median Household Income
Median Household Income Comparison
Italians
Immigrants from Latvia
$92,475
MEDIAN HOUSEHOLD INCOME
99.1/ 100
METRIC RATING
83rd/ 347
METRIC RANK
$93,602
MEDIAN HOUSEHOLD INCOME
99.6/ 100
METRIC RATING
74th/ 347
METRIC RANK
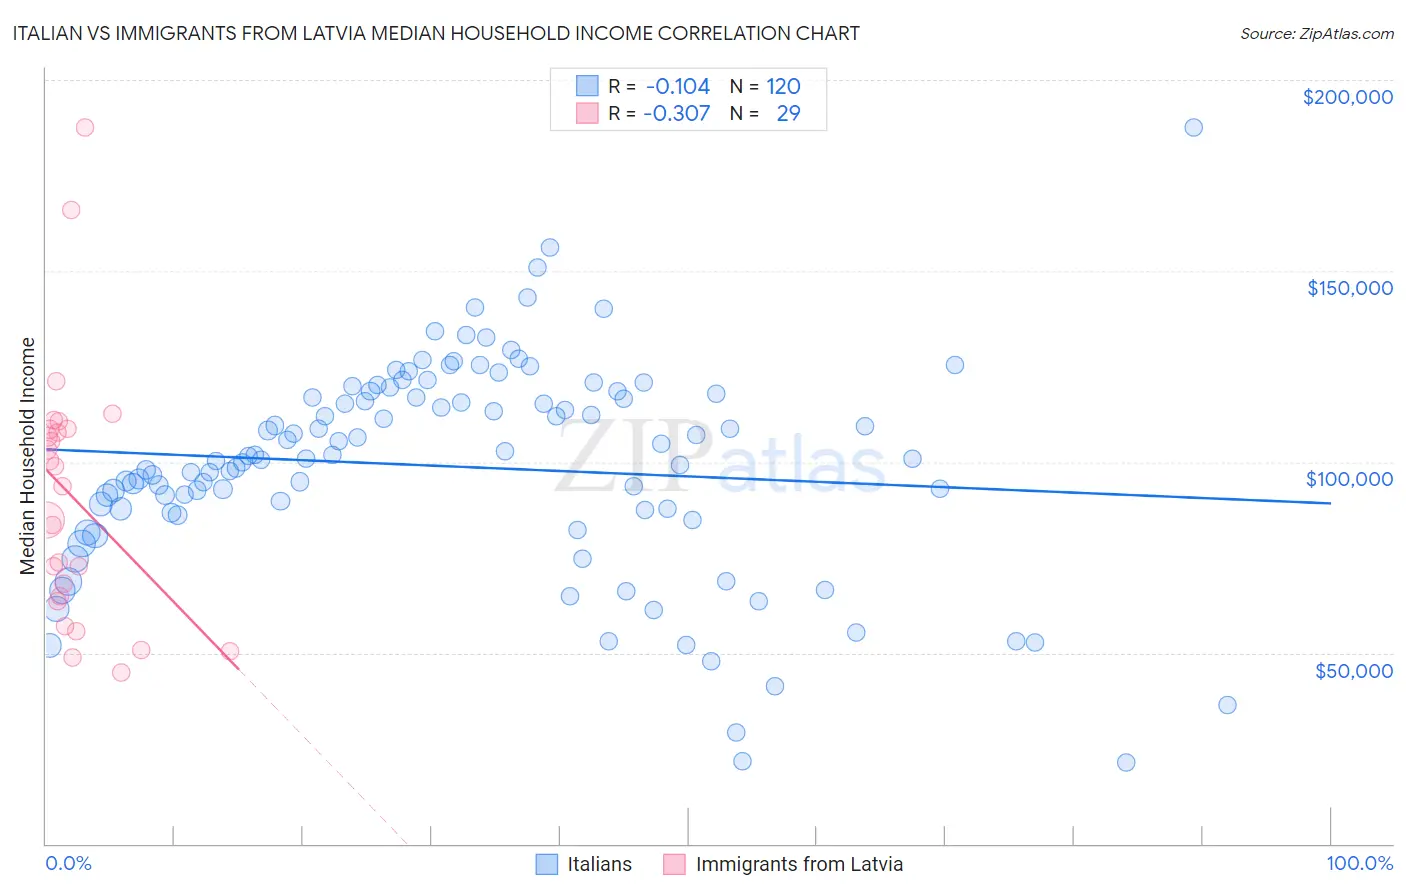
Italian vs Immigrants from Latvia Median Household Income Correlation Chart
The statistical analysis conducted on geographies consisting of 573,867,135 people shows a poor negative correlation between the proportion of Italians and median household income in the United States with a correlation coefficient (R) of -0.104 and weighted average of $92,475. Similarly, the statistical analysis conducted on geographies consisting of 113,726,313 people shows a mild negative correlation between the proportion of Immigrants from Latvia and median household income in the United States with a correlation coefficient (R) of -0.307 and weighted average of $93,602, a difference of 1.2%.
Median Household Income Correlation Summary
| Measurement | Italian | Immigrants from Latvia |
| Minimum | $21,250 | $44,737 |
| Maximum | $187,614 | $187,593 |
| Range | $166,364 | $142,856 |
| Mean | $98,796 | $90,790 |
| Median | $100,721 | $93,558 |
| Interquartile 25% (IQ1) | $86,997 | $64,215 |
| Interquartile 75% (IQ3) | $117,408 | $108,638 |
| Interquartile Range (IQR) | $30,412 | $44,423 |
| Standard Deviation (Sample) | $27,952 | $33,495 |
| Standard Deviation (Population) | $27,836 | $32,912 |
Demographics Similar to Italians and Immigrants from Latvia by Median Household Income
In terms of median household income, the demographic groups most similar to Italians are Immigrants from Argentina ($92,417, a difference of 0.060%), Immigrants from Croatia ($92,225, a difference of 0.27%), Immigrants from Spain ($92,732, a difference of 0.28%), Immigrants from England ($92,098, a difference of 0.41%), and Immigrants from Hungary ($92,094, a difference of 0.41%). Similarly, the demographic groups most similar to Immigrants from Latvia are Immigrants from Egypt ($93,700, a difference of 0.10%), Immigrants from Italy ($93,465, a difference of 0.15%), South African ($93,379, a difference of 0.24%), Immigrants from Afghanistan ($93,375, a difference of 0.24%), and Lithuanian ($93,852, a difference of 0.27%).
| Demographics | Rating | Rank | Median Household Income |
| Mongolians | 99.7 /100 | #68 | Exceptional $93,971 |
| Argentineans | 99.7 /100 | #69 | Exceptional $93,960 |
| Immigrants | Fiji | 99.7 /100 | #70 | Exceptional $93,933 |
| Immigrants | Philippines | 99.6 /100 | #71 | Exceptional $93,899 |
| Lithuanians | 99.6 /100 | #72 | Exceptional $93,852 |
| Immigrants | Egypt | 99.6 /100 | #73 | Exceptional $93,700 |
| Immigrants | Latvia | 99.6 /100 | #74 | Exceptional $93,602 |
| Immigrants | Italy | 99.5 /100 | #75 | Exceptional $93,465 |
| South Africans | 99.5 /100 | #76 | Exceptional $93,379 |
| Immigrants | Afghanistan | 99.5 /100 | #77 | Exceptional $93,375 |
| Immigrants | Bulgaria | 99.4 /100 | #78 | Exceptional $93,148 |
| Sri Lankans | 99.4 /100 | #79 | Exceptional $93,093 |
| Tongans | 99.4 /100 | #80 | Exceptional $93,076 |
| Immigrants | Eastern Europe | 99.4 /100 | #81 | Exceptional $93,051 |
| Immigrants | Spain | 99.3 /100 | #82 | Exceptional $92,732 |
| Italians | 99.1 /100 | #83 | Exceptional $92,475 |
| Immigrants | Argentina | 99.1 /100 | #84 | Exceptional $92,417 |
| Immigrants | Croatia | 99.0 /100 | #85 | Exceptional $92,225 |
| Immigrants | England | 98.9 /100 | #86 | Exceptional $92,098 |
| Immigrants | Hungary | 98.9 /100 | #87 | Exceptional $92,094 |
| Immigrants | Canada | 98.8 /100 | #88 | Exceptional $92,029 |