Vietnamese vs Immigrants from Dominican Republic Median Household Income
COMPARE
Vietnamese
Immigrants from Dominican Republic
Median Household Income
Median Household Income Comparison
Vietnamese
Immigrants from Dominican Republic
$82,248
MEDIAN HOUSEHOLD INCOME
13.8/ 100
METRIC RATING
215th/ 347
METRIC RANK
$70,208
MEDIAN HOUSEHOLD INCOME
0.0/ 100
METRIC RATING
319th/ 347
METRIC RANK
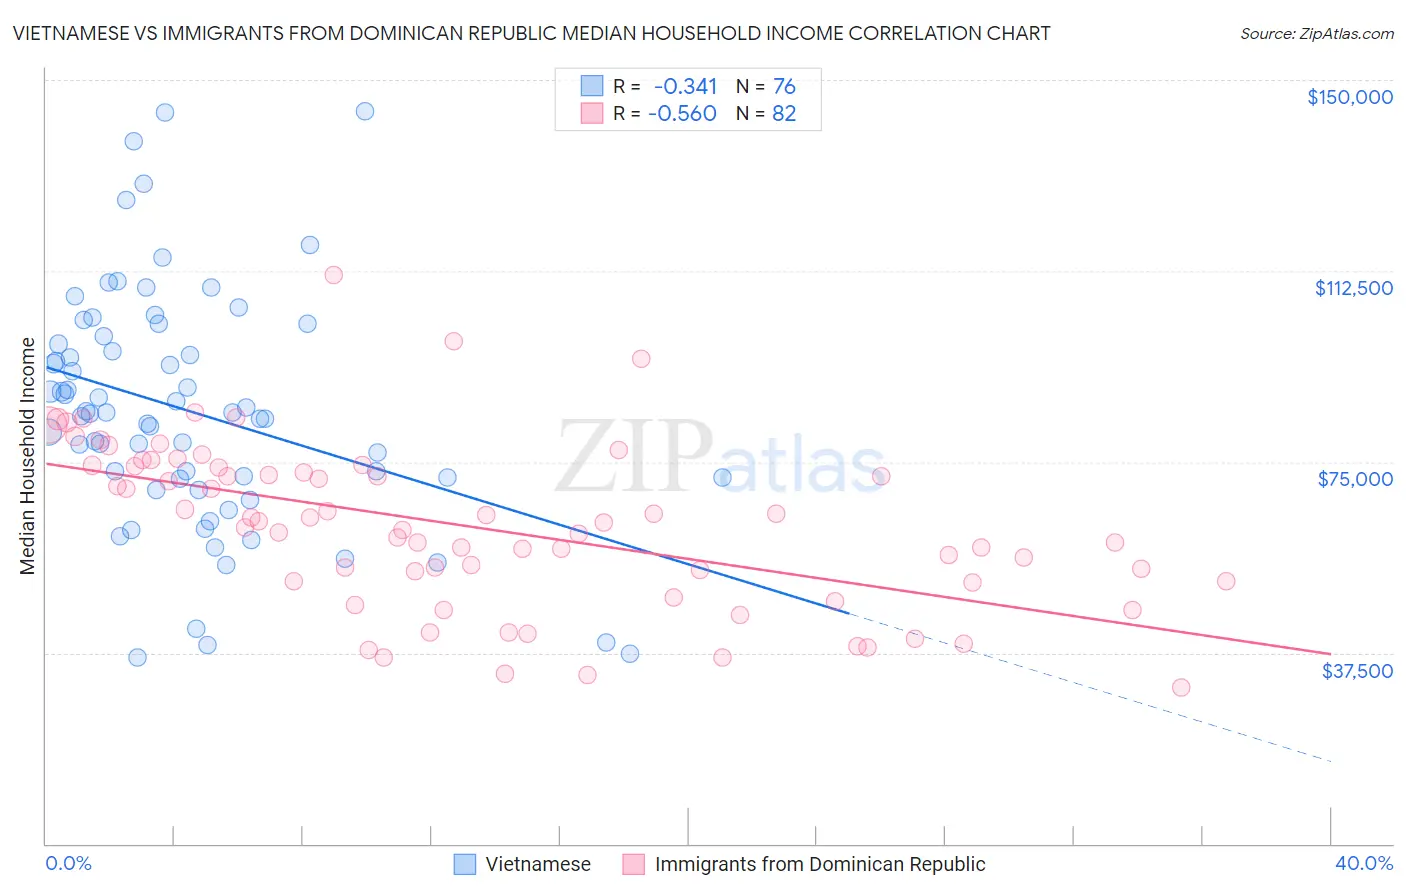
Vietnamese vs Immigrants from Dominican Republic Median Household Income Correlation Chart
The statistical analysis conducted on geographies consisting of 170,624,806 people shows a mild negative correlation between the proportion of Vietnamese and median household income in the United States with a correlation coefficient (R) of -0.341 and weighted average of $82,248. Similarly, the statistical analysis conducted on geographies consisting of 274,922,738 people shows a substantial negative correlation between the proportion of Immigrants from Dominican Republic and median household income in the United States with a correlation coefficient (R) of -0.560 and weighted average of $70,208, a difference of 17.2%.
Median Household Income Correlation Summary
| Measurement | Vietnamese | Immigrants from Dominican Republic |
| Minimum | $36,578 | $30,696 |
| Maximum | $143,859 | $111,701 |
| Range | $107,281 | $81,005 |
| Mean | $84,974 | $62,334 |
| Median | $84,533 | $62,616 |
| Interquartile 25% (IQ1) | $71,810 | $51,486 |
| Interquartile 75% (IQ3) | $98,943 | $74,129 |
| Interquartile Range (IQR) | $27,134 | $22,642 |
| Standard Deviation (Sample) | $23,335 | $16,292 |
| Standard Deviation (Population) | $23,181 | $16,192 |
Similar Demographics by Median Household Income
Demographics Similar to Vietnamese by Median Household Income
In terms of median household income, the demographic groups most similar to Vietnamese are Panamanian ($82,272, a difference of 0.030%), Yugoslavian ($82,186, a difference of 0.070%), Nepalese ($82,410, a difference of 0.20%), Venezuelan ($82,432, a difference of 0.22%), and Ecuadorian ($82,070, a difference of 0.22%).
| Demographics | Rating | Rank | Median Household Income |
| French Canadians | 18.7 /100 | #208 | Poor $82,810 |
| Immigrants | Iraq | 16.7 /100 | #209 | Poor $82,594 |
| Immigrants | Uruguay | 16.4 /100 | #210 | Poor $82,560 |
| Salvadorans | 15.4 /100 | #211 | Poor $82,449 |
| Venezuelans | 15.3 /100 | #212 | Poor $82,432 |
| Nepalese | 15.1 /100 | #213 | Poor $82,410 |
| Panamanians | 14.0 /100 | #214 | Poor $82,272 |
| Vietnamese | 13.8 /100 | #215 | Poor $82,248 |
| Yugoslavians | 13.3 /100 | #216 | Poor $82,186 |
| Ecuadorians | 12.5 /100 | #217 | Poor $82,070 |
| Whites/Caucasians | 12.2 /100 | #218 | Poor $82,029 |
| Nigerians | 10.3 /100 | #219 | Poor $81,725 |
| Immigrants | Venezuela | 9.0 /100 | #220 | Tragic $81,506 |
| Immigrants | Ghana | 9.0 /100 | #221 | Tragic $81,489 |
| Immigrants | Nigeria | 7.7 /100 | #222 | Tragic $81,236 |
Demographics Similar to Immigrants from Dominican Republic by Median Household Income
In terms of median household income, the demographic groups most similar to Immigrants from Dominican Republic are Colville ($70,094, a difference of 0.16%), Chickasaw ($70,005, a difference of 0.29%), Choctaw ($69,947, a difference of 0.37%), Chippewa ($70,539, a difference of 0.47%), and Cajun ($70,605, a difference of 0.56%).
| Demographics | Rating | Rank | Median Household Income |
| Immigrants | Honduras | 0.0 /100 | #312 | Tragic $71,452 |
| Immigrants | Bahamas | 0.0 /100 | #313 | Tragic $71,349 |
| Dominicans | 0.0 /100 | #314 | Tragic $71,302 |
| Ottawa | 0.0 /100 | #315 | Tragic $70,984 |
| Apache | 0.0 /100 | #316 | Tragic $70,927 |
| Cajuns | 0.0 /100 | #317 | Tragic $70,605 |
| Chippewa | 0.0 /100 | #318 | Tragic $70,539 |
| Immigrants | Dominican Republic | 0.0 /100 | #319 | Tragic $70,208 |
| Colville | 0.0 /100 | #320 | Tragic $70,094 |
| Chickasaw | 0.0 /100 | #321 | Tragic $70,005 |
| Choctaw | 0.0 /100 | #322 | Tragic $69,947 |
| Bahamians | 0.0 /100 | #323 | Tragic $69,726 |
| Yup'ik | 0.0 /100 | #324 | Tragic $69,695 |
| Seminole | 0.0 /100 | #325 | Tragic $69,420 |
| Yuman | 0.0 /100 | #326 | Tragic $68,743 |