Vietnamese vs Carpatho Rusyn Median Household Income
COMPARE
Vietnamese
Carpatho Rusyn
Median Household Income
Median Household Income Comparison
Vietnamese
Carpatho Rusyns
$82,248
MEDIAN HOUSEHOLD INCOME
13.8/ 100
METRIC RATING
215th/ 347
METRIC RANK
$86,635
MEDIAN HOUSEHOLD INCOME
72.8/ 100
METRIC RATING
155th/ 347
METRIC RANK
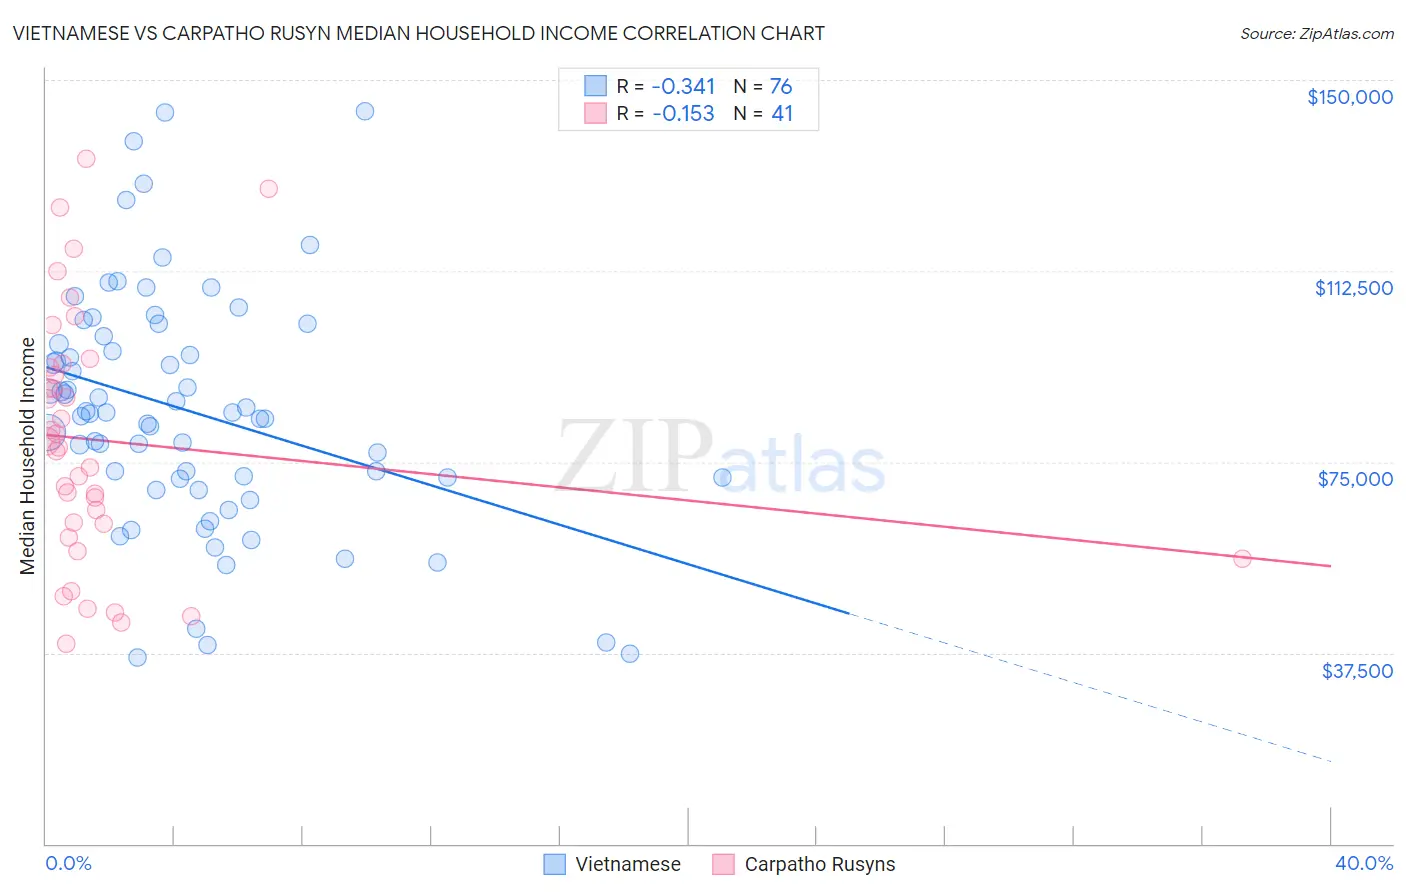
Vietnamese vs Carpatho Rusyn Median Household Income Correlation Chart
The statistical analysis conducted on geographies consisting of 170,624,806 people shows a mild negative correlation between the proportion of Vietnamese and median household income in the United States with a correlation coefficient (R) of -0.341 and weighted average of $82,248. Similarly, the statistical analysis conducted on geographies consisting of 58,866,106 people shows a poor negative correlation between the proportion of Carpatho Rusyns and median household income in the United States with a correlation coefficient (R) of -0.153 and weighted average of $86,635, a difference of 5.3%.
Median Household Income Correlation Summary
| Measurement | Vietnamese | Carpatho Rusyn |
| Minimum | $36,578 | $39,318 |
| Maximum | $143,859 | $134,440 |
| Range | $107,281 | $95,122 |
| Mean | $84,974 | $79,082 |
| Median | $84,533 | $77,705 |
| Interquartile 25% (IQ1) | $71,810 | $61,521 |
| Interquartile 75% (IQ3) | $98,943 | $93,841 |
| Interquartile Range (IQR) | $27,134 | $32,321 |
| Standard Deviation (Sample) | $23,335 | $24,465 |
| Standard Deviation (Population) | $23,181 | $24,165 |
Similar Demographics by Median Household Income
Demographics Similar to Vietnamese by Median Household Income
In terms of median household income, the demographic groups most similar to Vietnamese are Panamanian ($82,272, a difference of 0.030%), Yugoslavian ($82,186, a difference of 0.070%), Nepalese ($82,410, a difference of 0.20%), Venezuelan ($82,432, a difference of 0.22%), and Ecuadorian ($82,070, a difference of 0.22%).
| Demographics | Rating | Rank | Median Household Income |
| French Canadians | 18.7 /100 | #208 | Poor $82,810 |
| Immigrants | Iraq | 16.7 /100 | #209 | Poor $82,594 |
| Immigrants | Uruguay | 16.4 /100 | #210 | Poor $82,560 |
| Salvadorans | 15.4 /100 | #211 | Poor $82,449 |
| Venezuelans | 15.3 /100 | #212 | Poor $82,432 |
| Nepalese | 15.1 /100 | #213 | Poor $82,410 |
| Panamanians | 14.0 /100 | #214 | Poor $82,272 |
| Vietnamese | 13.8 /100 | #215 | Poor $82,248 |
| Yugoslavians | 13.3 /100 | #216 | Poor $82,186 |
| Ecuadorians | 12.5 /100 | #217 | Poor $82,070 |
| Whites/Caucasians | 12.2 /100 | #218 | Poor $82,029 |
| Nigerians | 10.3 /100 | #219 | Poor $81,725 |
| Immigrants | Venezuela | 9.0 /100 | #220 | Tragic $81,506 |
| Immigrants | Ghana | 9.0 /100 | #221 | Tragic $81,489 |
| Immigrants | Nigeria | 7.7 /100 | #222 | Tragic $81,236 |
Demographics Similar to Carpatho Rusyns by Median Household Income
In terms of median household income, the demographic groups most similar to Carpatho Rusyns are Immigrants from Albania ($86,534, a difference of 0.12%), Immigrants from Germany ($86,764, a difference of 0.15%), Samoan ($86,498, a difference of 0.16%), Moroccan ($86,468, a difference of 0.19%), and South American ($86,824, a difference of 0.22%).
| Demographics | Rating | Rank | Median Household Income |
| Costa Ricans | 80.0 /100 | #148 | Excellent $87,262 |
| Immigrants | Nepal | 77.7 /100 | #149 | Good $87,046 |
| Basques | 77.2 /100 | #150 | Good $87,001 |
| Hungarians | 76.3 /100 | #151 | Good $86,920 |
| Immigrants | Saudi Arabia | 75.8 /100 | #152 | Good $86,875 |
| South Americans | 75.1 /100 | #153 | Good $86,824 |
| Immigrants | Germany | 74.4 /100 | #154 | Good $86,764 |
| Carpatho Rusyns | 72.8 /100 | #155 | Good $86,635 |
| Immigrants | Albania | 71.5 /100 | #156 | Good $86,534 |
| Samoans | 71.0 /100 | #157 | Good $86,498 |
| Moroccans | 70.6 /100 | #158 | Good $86,468 |
| Immigrants | Uzbekistan | 70.1 /100 | #159 | Good $86,425 |
| Luxembourgers | 70.0 /100 | #160 | Good $86,418 |
| Slavs | 69.7 /100 | #161 | Good $86,398 |
| Guamanians/Chamorros | 67.7 /100 | #162 | Good $86,255 |