Vietnamese vs Immigrants from Latvia Per Capita Income
COMPARE
Vietnamese
Immigrants from Latvia
Per Capita Income
Per Capita Income Comparison
Vietnamese
Immigrants from Latvia
$42,368
PER CAPITA INCOME
19.0/ 100
METRIC RATING
200th/ 347
METRIC RANK
$50,914
PER CAPITA INCOME
100.0/ 100
METRIC RATING
46th/ 347
METRIC RANK
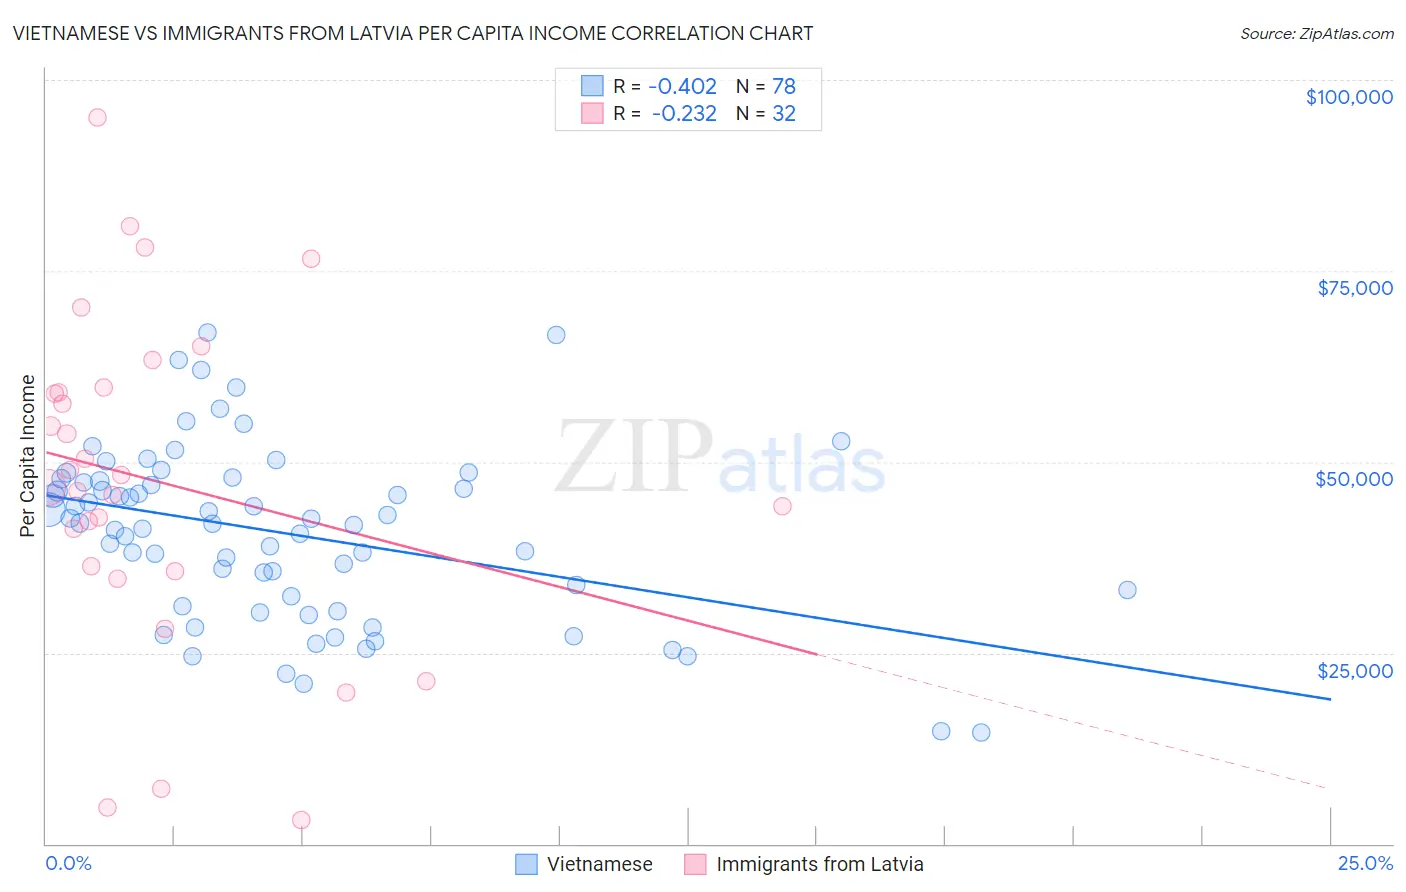
Vietnamese vs Immigrants from Latvia Per Capita Income Correlation Chart
The statistical analysis conducted on geographies consisting of 170,759,165 people shows a moderate negative correlation between the proportion of Vietnamese and per capita income in the United States with a correlation coefficient (R) of -0.402 and weighted average of $42,368. Similarly, the statistical analysis conducted on geographies consisting of 113,739,608 people shows a weak negative correlation between the proportion of Immigrants from Latvia and per capita income in the United States with a correlation coefficient (R) of -0.232 and weighted average of $50,914, a difference of 20.2%.
Per Capita Income Correlation Summary
| Measurement | Vietnamese | Immigrants from Latvia |
| Minimum | $14,629 | $3,055 |
| Maximum | $66,907 | $95,062 |
| Range | $52,278 | $92,007 |
| Mean | $40,731 | $47,518 |
| Median | $41,985 | $47,530 |
| Interquartile 25% (IQ1) | $32,361 | $35,985 |
| Interquartile 75% (IQ3) | $47,484 | $59,433 |
| Interquartile Range (IQR) | $15,123 | $23,448 |
| Standard Deviation (Sample) | $11,295 | $21,734 |
| Standard Deviation (Population) | $11,222 | $21,392 |
Similar Demographics by Per Capita Income
Demographics Similar to Vietnamese by Per Capita Income
In terms of per capita income, the demographic groups most similar to Vietnamese are Barbadian ($42,406, a difference of 0.090%), Immigrants from Portugal ($42,412, a difference of 0.10%), Immigrants from Thailand ($42,289, a difference of 0.19%), Immigrants from Bosnia and Herzegovina ($42,278, a difference of 0.21%), and Spanish ($42,249, a difference of 0.28%).
| Demographics | Rating | Rank | Per Capita Income |
| Immigrants | Sierra Leone | 26.5 /100 | #193 | Fair $42,752 |
| Immigrants | Fiji | 25.2 /100 | #194 | Fair $42,694 |
| Immigrants | Kenya | 24.5 /100 | #195 | Fair $42,661 |
| Dutch | 23.4 /100 | #196 | Fair $42,605 |
| Scotch-Irish | 22.6 /100 | #197 | Fair $42,563 |
| Immigrants | Portugal | 19.7 /100 | #198 | Poor $42,412 |
| Barbadians | 19.6 /100 | #199 | Poor $42,406 |
| Vietnamese | 19.0 /100 | #200 | Poor $42,368 |
| Immigrants | Thailand | 17.6 /100 | #201 | Poor $42,289 |
| Immigrants | Bosnia and Herzegovina | 17.5 /100 | #202 | Poor $42,278 |
| Spanish | 17.0 /100 | #203 | Poor $42,249 |
| Aleuts | 16.4 /100 | #204 | Poor $42,210 |
| Whites/Caucasians | 15.9 /100 | #205 | Poor $42,180 |
| Ghanaians | 15.7 /100 | #206 | Poor $42,164 |
| Venezuelans | 14.4 /100 | #207 | Poor $42,074 |
Demographics Similar to Immigrants from Latvia by Per Capita Income
In terms of per capita income, the demographic groups most similar to Immigrants from Latvia are Bulgarian ($50,906, a difference of 0.020%), Immigrants from Spain ($50,933, a difference of 0.040%), Immigrants from Europe ($50,950, a difference of 0.070%), Immigrants from Serbia ($50,810, a difference of 0.21%), and New Zealander ($50,575, a difference of 0.67%).
| Demographics | Rating | Rank | Per Capita Income |
| Cambodians | 100.0 /100 | #39 | Exceptional $51,731 |
| Immigrants | Korea | 100.0 /100 | #40 | Exceptional $51,671 |
| Immigrants | South Africa | 100.0 /100 | #41 | Exceptional $51,465 |
| Immigrants | Turkey | 100.0 /100 | #42 | Exceptional $51,368 |
| Immigrants | Lithuania | 100.0 /100 | #43 | Exceptional $51,361 |
| Immigrants | Europe | 100.0 /100 | #44 | Exceptional $50,950 |
| Immigrants | Spain | 100.0 /100 | #45 | Exceptional $50,933 |
| Immigrants | Latvia | 100.0 /100 | #46 | Exceptional $50,914 |
| Bulgarians | 100.0 /100 | #47 | Exceptional $50,906 |
| Immigrants | Serbia | 100.0 /100 | #48 | Exceptional $50,810 |
| New Zealanders | 100.0 /100 | #49 | Exceptional $50,575 |
| Immigrants | Sri Lanka | 100.0 /100 | #50 | Exceptional $50,555 |
| Immigrants | Netherlands | 100.0 /100 | #51 | Exceptional $50,458 |
| Immigrants | Croatia | 99.9 /100 | #52 | Exceptional $50,417 |
| Paraguayans | 99.9 /100 | #53 | Exceptional $50,385 |