Subsaharan African vs Immigrants from Latvia Median Household Income
COMPARE
Subsaharan African
Immigrants from Latvia
Median Household Income
Median Household Income Comparison
Sub-Saharan Africans
Immigrants from Latvia
$77,631
MEDIAN HOUSEHOLD INCOME
0.8/ 100
METRIC RATING
254th/ 347
METRIC RANK
$93,602
MEDIAN HOUSEHOLD INCOME
99.6/ 100
METRIC RATING
74th/ 347
METRIC RANK
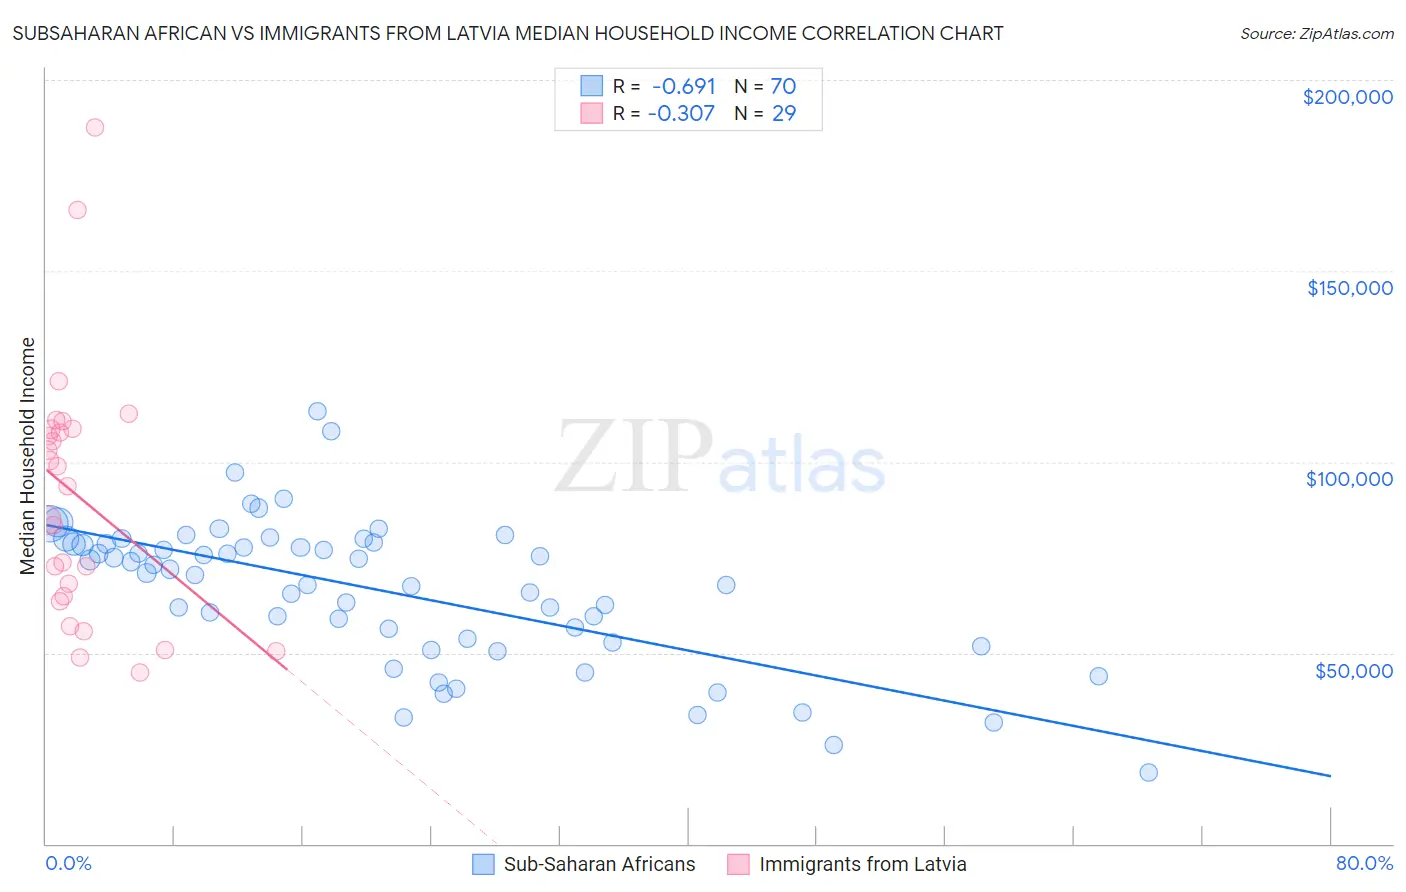
Subsaharan African vs Immigrants from Latvia Median Household Income Correlation Chart
The statistical analysis conducted on geographies consisting of 507,380,534 people shows a significant negative correlation between the proportion of Sub-Saharan Africans and median household income in the United States with a correlation coefficient (R) of -0.691 and weighted average of $77,631. Similarly, the statistical analysis conducted on geographies consisting of 113,726,313 people shows a mild negative correlation between the proportion of Immigrants from Latvia and median household income in the United States with a correlation coefficient (R) of -0.307 and weighted average of $93,602, a difference of 20.6%.
Median Household Income Correlation Summary
| Measurement | Subsaharan African | Immigrants from Latvia |
| Minimum | $18,750 | $44,737 |
| Maximum | $113,418 | $187,593 |
| Range | $94,668 | $142,856 |
| Mean | $66,483 | $90,790 |
| Median | $71,386 | $93,558 |
| Interquartile 25% (IQ1) | $53,589 | $64,215 |
| Interquartile 75% (IQ3) | $78,576 | $108,638 |
| Interquartile Range (IQR) | $24,988 | $44,423 |
| Standard Deviation (Sample) | $18,848 | $33,495 |
| Standard Deviation (Population) | $18,713 | $32,912 |
Similar Demographics by Median Household Income
Demographics Similar to Sub-Saharan Africans by Median Household Income
In terms of median household income, the demographic groups most similar to Sub-Saharan Africans are Immigrants from St. Vincent and the Grenadines ($77,690, a difference of 0.080%), Immigrants from Middle Africa ($77,559, a difference of 0.090%), Immigrants from West Indies ($77,956, a difference of 0.42%), Mexican American Indian ($78,166, a difference of 0.69%), and Belizean ($77,028, a difference of 0.78%).
| Demographics | Rating | Rank | Median Household Income |
| Immigrants | Burma/Myanmar | 1.6 /100 | #247 | Tragic $78,682 |
| Sudanese | 1.5 /100 | #248 | Tragic $78,529 |
| West Indians | 1.4 /100 | #249 | Tragic $78,455 |
| Immigrants | Laos | 1.3 /100 | #250 | Tragic $78,327 |
| Mexican American Indians | 1.2 /100 | #251 | Tragic $78,166 |
| Immigrants | West Indies | 1.0 /100 | #252 | Tragic $77,956 |
| Immigrants | St. Vincent and the Grenadines | 0.9 /100 | #253 | Tragic $77,690 |
| Sub-Saharan Africans | 0.8 /100 | #254 | Tragic $77,631 |
| Immigrants | Middle Africa | 0.8 /100 | #255 | Tragic $77,559 |
| Belizeans | 0.6 /100 | #256 | Tragic $77,028 |
| Immigrants | Senegal | 0.5 /100 | #257 | Tragic $76,915 |
| Immigrants | Nicaragua | 0.5 /100 | #258 | Tragic $76,784 |
| Spanish American Indians | 0.4 /100 | #259 | Tragic $76,670 |
| Jamaicans | 0.4 /100 | #260 | Tragic $76,583 |
| Immigrants | Grenada | 0.4 /100 | #261 | Tragic $76,517 |
Demographics Similar to Immigrants from Latvia by Median Household Income
In terms of median household income, the demographic groups most similar to Immigrants from Latvia are Immigrants from Egypt ($93,700, a difference of 0.10%), Immigrants from Italy ($93,465, a difference of 0.15%), South African ($93,379, a difference of 0.24%), Immigrants from Afghanistan ($93,375, a difference of 0.24%), and Lithuanian ($93,852, a difference of 0.27%).
| Demographics | Rating | Rank | Median Household Income |
| Immigrants | Scotland | 99.7 /100 | #67 | Exceptional $94,091 |
| Mongolians | 99.7 /100 | #68 | Exceptional $93,971 |
| Argentineans | 99.7 /100 | #69 | Exceptional $93,960 |
| Immigrants | Fiji | 99.7 /100 | #70 | Exceptional $93,933 |
| Immigrants | Philippines | 99.6 /100 | #71 | Exceptional $93,899 |
| Lithuanians | 99.6 /100 | #72 | Exceptional $93,852 |
| Immigrants | Egypt | 99.6 /100 | #73 | Exceptional $93,700 |
| Immigrants | Latvia | 99.6 /100 | #74 | Exceptional $93,602 |
| Immigrants | Italy | 99.5 /100 | #75 | Exceptional $93,465 |
| South Africans | 99.5 /100 | #76 | Exceptional $93,379 |
| Immigrants | Afghanistan | 99.5 /100 | #77 | Exceptional $93,375 |
| Immigrants | Bulgaria | 99.4 /100 | #78 | Exceptional $93,148 |
| Sri Lankans | 99.4 /100 | #79 | Exceptional $93,093 |
| Tongans | 99.4 /100 | #80 | Exceptional $93,076 |
| Immigrants | Eastern Europe | 99.4 /100 | #81 | Exceptional $93,051 |