Irish vs Immigrants from Latvia Median Household Income
COMPARE
Irish
Immigrants from Latvia
Median Household Income
Median Household Income Comparison
Irish
Immigrants from Latvia
$86,145
MEDIAN HOUSEHOLD INCOME
66.2/ 100
METRIC RATING
164th/ 347
METRIC RANK
$93,602
MEDIAN HOUSEHOLD INCOME
99.6/ 100
METRIC RATING
74th/ 347
METRIC RANK
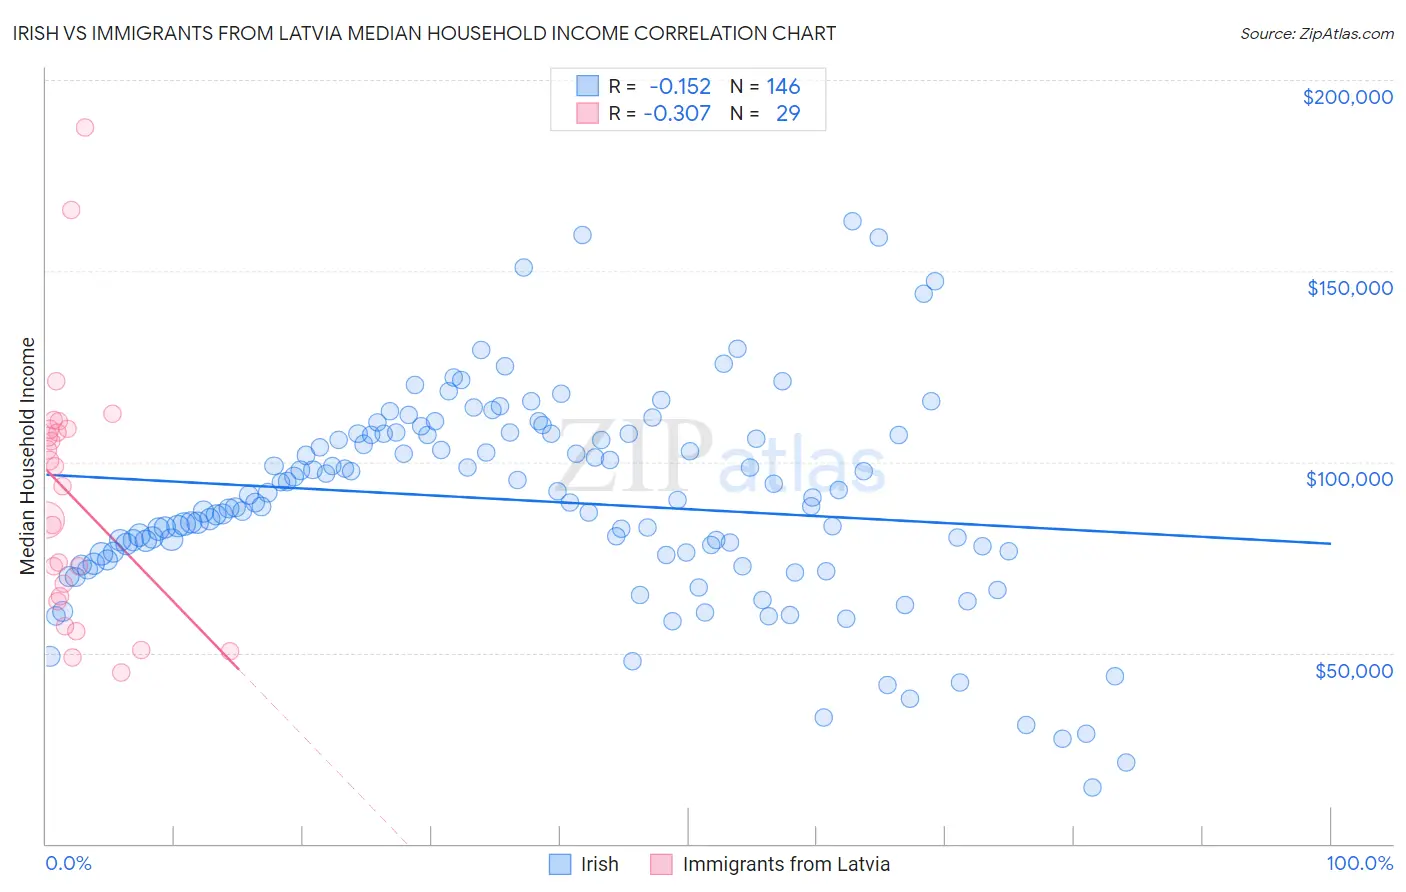
Irish vs Immigrants from Latvia Median Household Income Correlation Chart
The statistical analysis conducted on geographies consisting of 579,055,037 people shows a poor negative correlation between the proportion of Irish and median household income in the United States with a correlation coefficient (R) of -0.152 and weighted average of $86,145. Similarly, the statistical analysis conducted on geographies consisting of 113,726,313 people shows a mild negative correlation between the proportion of Immigrants from Latvia and median household income in the United States with a correlation coefficient (R) of -0.307 and weighted average of $93,602, a difference of 8.7%.
Median Household Income Correlation Summary
| Measurement | Irish | Immigrants from Latvia |
| Minimum | $14,837 | $44,737 |
| Maximum | $162,948 | $187,593 |
| Range | $148,111 | $142,856 |
| Mean | $89,921 | $90,790 |
| Median | $89,704 | $93,558 |
| Interquartile 25% (IQ1) | $76,304 | $64,215 |
| Interquartile 75% (IQ3) | $107,042 | $108,638 |
| Interquartile Range (IQR) | $30,738 | $44,423 |
| Standard Deviation (Sample) | $26,625 | $33,495 |
| Standard Deviation (Population) | $26,534 | $32,912 |
Similar Demographics by Median Household Income
Demographics Similar to Irish by Median Household Income
In terms of median household income, the demographic groups most similar to Irish are Czech ($86,164, a difference of 0.020%), Norwegian ($86,084, a difference of 0.070%), Scandinavian ($86,073, a difference of 0.080%), Guamanian/Chamorro ($86,255, a difference of 0.13%), and Slavic ($86,398, a difference of 0.29%).
| Demographics | Rating | Rank | Median Household Income |
| Samoans | 71.0 /100 | #157 | Good $86,498 |
| Moroccans | 70.6 /100 | #158 | Good $86,468 |
| Immigrants | Uzbekistan | 70.1 /100 | #159 | Good $86,425 |
| Luxembourgers | 70.0 /100 | #160 | Good $86,418 |
| Slavs | 69.7 /100 | #161 | Good $86,398 |
| Guamanians/Chamorros | 67.7 /100 | #162 | Good $86,255 |
| Czechs | 66.4 /100 | #163 | Good $86,164 |
| Irish | 66.2 /100 | #164 | Good $86,145 |
| Norwegians | 65.3 /100 | #165 | Good $86,084 |
| Scandinavians | 65.1 /100 | #166 | Good $86,073 |
| Immigrants | Immigrants | 61.3 /100 | #167 | Good $85,818 |
| Icelanders | 61.0 /100 | #168 | Good $85,797 |
| Colombians | 59.7 /100 | #169 | Average $85,716 |
| Swiss | 59.2 /100 | #170 | Average $85,681 |
| Immigrants | South America | 58.1 /100 | #171 | Average $85,611 |
Demographics Similar to Immigrants from Latvia by Median Household Income
In terms of median household income, the demographic groups most similar to Immigrants from Latvia are Immigrants from Egypt ($93,700, a difference of 0.10%), Immigrants from Italy ($93,465, a difference of 0.15%), South African ($93,379, a difference of 0.24%), Immigrants from Afghanistan ($93,375, a difference of 0.24%), and Lithuanian ($93,852, a difference of 0.27%).
| Demographics | Rating | Rank | Median Household Income |
| Immigrants | Scotland | 99.7 /100 | #67 | Exceptional $94,091 |
| Mongolians | 99.7 /100 | #68 | Exceptional $93,971 |
| Argentineans | 99.7 /100 | #69 | Exceptional $93,960 |
| Immigrants | Fiji | 99.7 /100 | #70 | Exceptional $93,933 |
| Immigrants | Philippines | 99.6 /100 | #71 | Exceptional $93,899 |
| Lithuanians | 99.6 /100 | #72 | Exceptional $93,852 |
| Immigrants | Egypt | 99.6 /100 | #73 | Exceptional $93,700 |
| Immigrants | Latvia | 99.6 /100 | #74 | Exceptional $93,602 |
| Immigrants | Italy | 99.5 /100 | #75 | Exceptional $93,465 |
| South Africans | 99.5 /100 | #76 | Exceptional $93,379 |
| Immigrants | Afghanistan | 99.5 /100 | #77 | Exceptional $93,375 |
| Immigrants | Bulgaria | 99.4 /100 | #78 | Exceptional $93,148 |
| Sri Lankans | 99.4 /100 | #79 | Exceptional $93,093 |
| Tongans | 99.4 /100 | #80 | Exceptional $93,076 |
| Immigrants | Eastern Europe | 99.4 /100 | #81 | Exceptional $93,051 |