Vietnamese vs Immigrants from Honduras Median Household Income
COMPARE
Vietnamese
Immigrants from Honduras
Median Household Income
Median Household Income Comparison
Vietnamese
Immigrants from Honduras
$82,248
MEDIAN HOUSEHOLD INCOME
13.8/ 100
METRIC RATING
215th/ 347
METRIC RANK
$71,452
MEDIAN HOUSEHOLD INCOME
0.0/ 100
METRIC RATING
312th/ 347
METRIC RANK
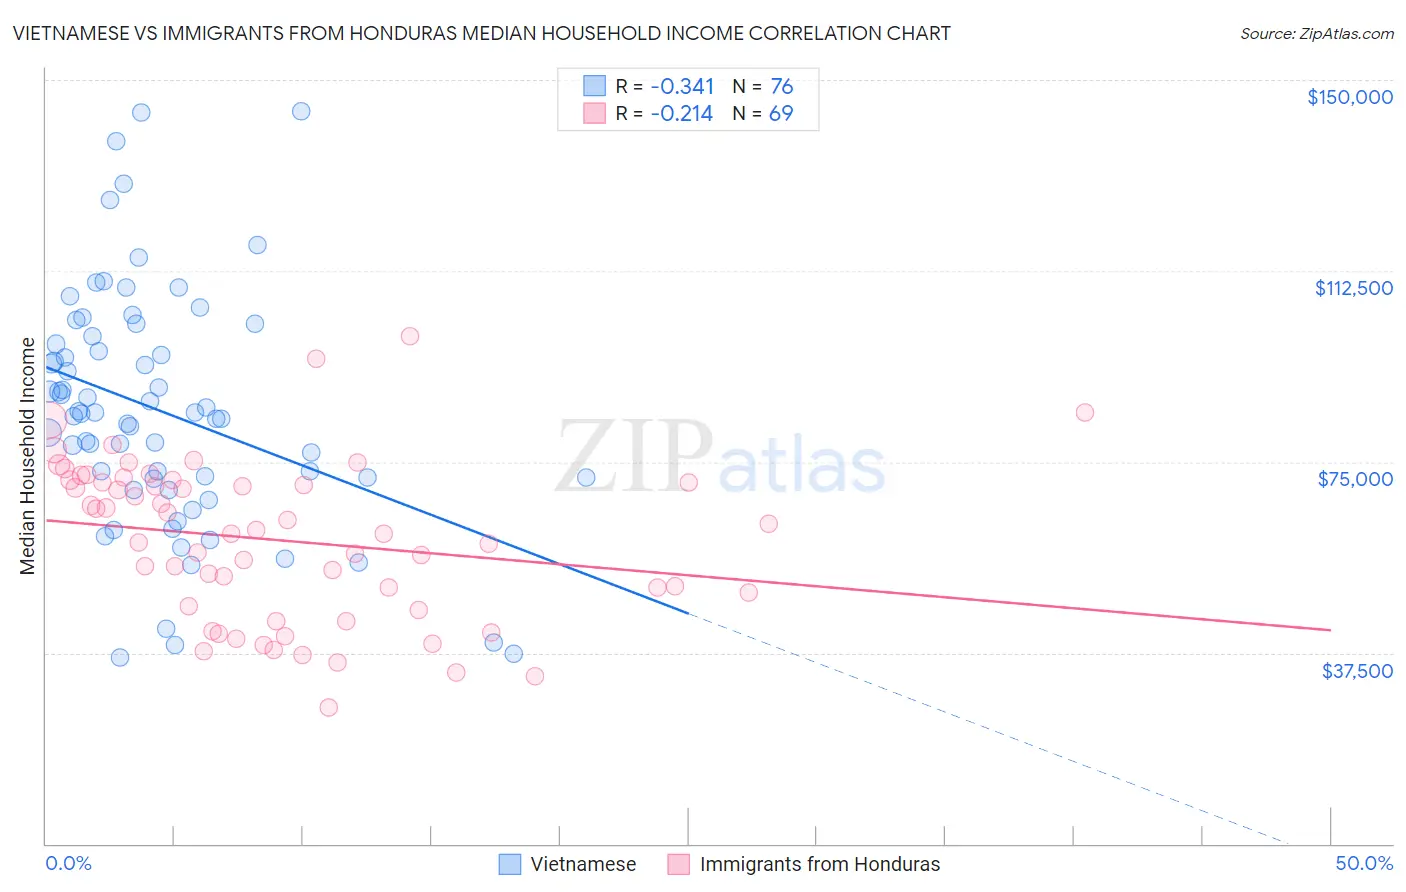
Vietnamese vs Immigrants from Honduras Median Household Income Correlation Chart
The statistical analysis conducted on geographies consisting of 170,624,806 people shows a mild negative correlation between the proportion of Vietnamese and median household income in the United States with a correlation coefficient (R) of -0.341 and weighted average of $82,248. Similarly, the statistical analysis conducted on geographies consisting of 322,411,098 people shows a weak negative correlation between the proportion of Immigrants from Honduras and median household income in the United States with a correlation coefficient (R) of -0.214 and weighted average of $71,452, a difference of 15.1%.
Median Household Income Correlation Summary
| Measurement | Vietnamese | Immigrants from Honduras |
| Minimum | $36,578 | $26,822 |
| Maximum | $143,859 | $99,647 |
| Range | $107,281 | $72,825 |
| Mean | $84,974 | $59,604 |
| Median | $84,533 | $60,896 |
| Interquartile 25% (IQ1) | $71,810 | $46,318 |
| Interquartile 75% (IQ3) | $98,943 | $71,168 |
| Interquartile Range (IQR) | $27,134 | $24,849 |
| Standard Deviation (Sample) | $23,335 | $15,574 |
| Standard Deviation (Population) | $23,181 | $15,460 |
Similar Demographics by Median Household Income
Demographics Similar to Vietnamese by Median Household Income
In terms of median household income, the demographic groups most similar to Vietnamese are Panamanian ($82,272, a difference of 0.030%), Yugoslavian ($82,186, a difference of 0.070%), Nepalese ($82,410, a difference of 0.20%), Venezuelan ($82,432, a difference of 0.22%), and Ecuadorian ($82,070, a difference of 0.22%).
| Demographics | Rating | Rank | Median Household Income |
| French Canadians | 18.7 /100 | #208 | Poor $82,810 |
| Immigrants | Iraq | 16.7 /100 | #209 | Poor $82,594 |
| Immigrants | Uruguay | 16.4 /100 | #210 | Poor $82,560 |
| Salvadorans | 15.4 /100 | #211 | Poor $82,449 |
| Venezuelans | 15.3 /100 | #212 | Poor $82,432 |
| Nepalese | 15.1 /100 | #213 | Poor $82,410 |
| Panamanians | 14.0 /100 | #214 | Poor $82,272 |
| Vietnamese | 13.8 /100 | #215 | Poor $82,248 |
| Yugoslavians | 13.3 /100 | #216 | Poor $82,186 |
| Ecuadorians | 12.5 /100 | #217 | Poor $82,070 |
| Whites/Caucasians | 12.2 /100 | #218 | Poor $82,029 |
| Nigerians | 10.3 /100 | #219 | Poor $81,725 |
| Immigrants | Venezuela | 9.0 /100 | #220 | Tragic $81,506 |
| Immigrants | Ghana | 9.0 /100 | #221 | Tragic $81,489 |
| Immigrants | Nigeria | 7.7 /100 | #222 | Tragic $81,236 |
Demographics Similar to Immigrants from Honduras by Median Household Income
In terms of median household income, the demographic groups most similar to Immigrants from Honduras are Immigrants from Bahamas ($71,349, a difference of 0.15%), Dominican ($71,302, a difference of 0.21%), Immigrants from Zaire ($71,801, a difference of 0.49%), U.S. Virgin Islander ($71,853, a difference of 0.56%), and Immigrants from Caribbean ($71,860, a difference of 0.57%).
| Demographics | Rating | Rank | Median Household Income |
| Hondurans | 0.0 /100 | #305 | Tragic $72,588 |
| Potawatomi | 0.0 /100 | #306 | Tragic $72,576 |
| Ute | 0.0 /100 | #307 | Tragic $72,402 |
| Yakama | 0.0 /100 | #308 | Tragic $72,225 |
| Immigrants | Caribbean | 0.0 /100 | #309 | Tragic $71,860 |
| U.S. Virgin Islanders | 0.0 /100 | #310 | Tragic $71,853 |
| Immigrants | Zaire | 0.0 /100 | #311 | Tragic $71,801 |
| Immigrants | Honduras | 0.0 /100 | #312 | Tragic $71,452 |
| Immigrants | Bahamas | 0.0 /100 | #313 | Tragic $71,349 |
| Dominicans | 0.0 /100 | #314 | Tragic $71,302 |
| Ottawa | 0.0 /100 | #315 | Tragic $70,984 |
| Apache | 0.0 /100 | #316 | Tragic $70,927 |
| Cajuns | 0.0 /100 | #317 | Tragic $70,605 |
| Chippewa | 0.0 /100 | #318 | Tragic $70,539 |
| Immigrants | Dominican Republic | 0.0 /100 | #319 | Tragic $70,208 |