Vietnamese vs Native Hawaiian Median Household Income
COMPARE
Vietnamese
Native Hawaiian
Median Household Income
Median Household Income Comparison
Vietnamese
Native Hawaiians
$82,248
MEDIAN HOUSEHOLD INCOME
13.8/ 100
METRIC RATING
215th/ 347
METRIC RANK
$89,919
MEDIAN HOUSEHOLD INCOME
95.7/ 100
METRIC RATING
116th/ 347
METRIC RANK
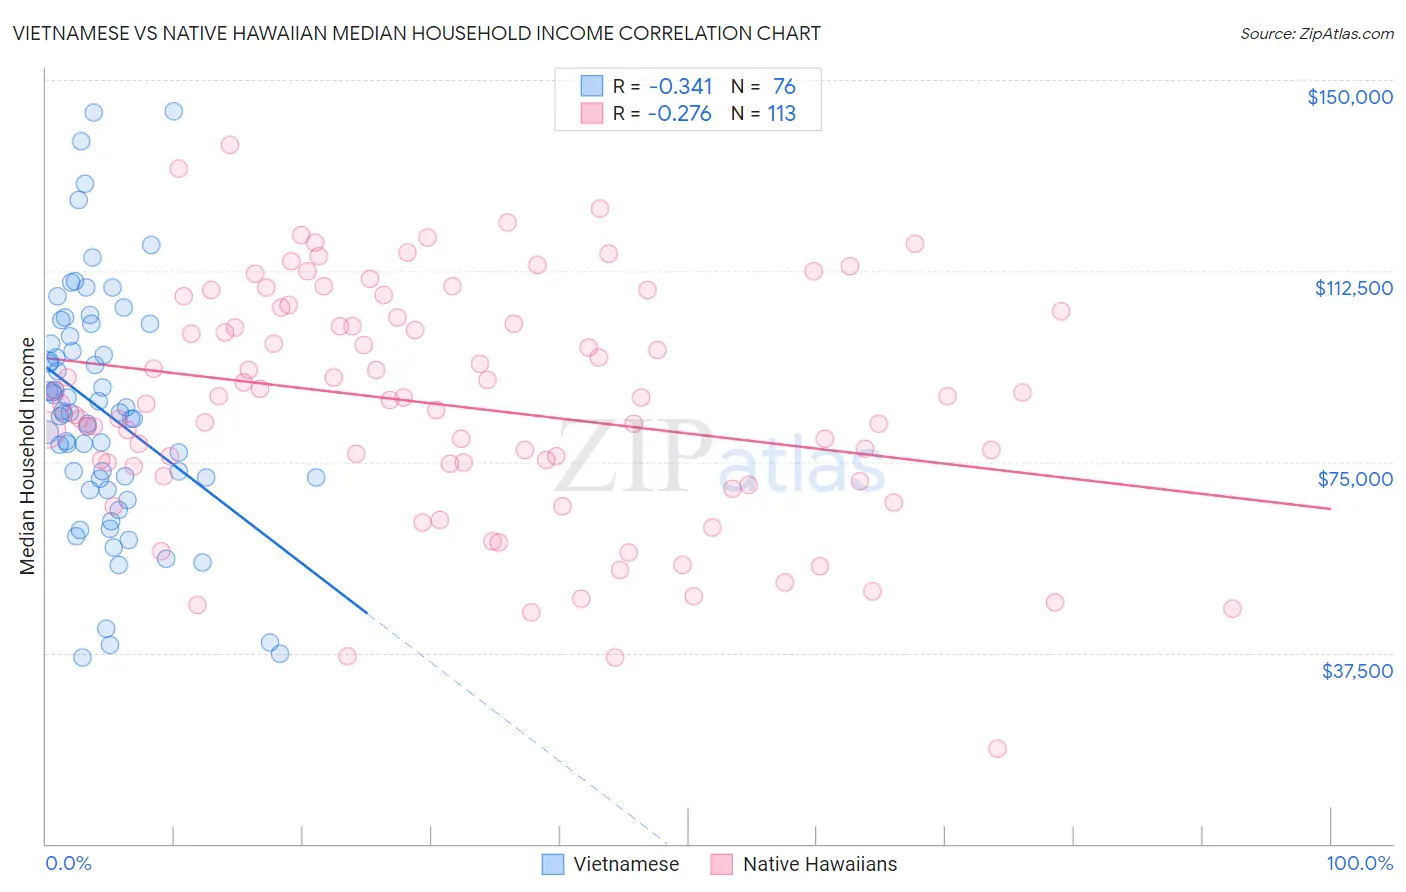
Vietnamese vs Native Hawaiian Median Household Income Correlation Chart
The statistical analysis conducted on geographies consisting of 170,624,806 people shows a mild negative correlation between the proportion of Vietnamese and median household income in the United States with a correlation coefficient (R) of -0.341 and weighted average of $82,248. Similarly, the statistical analysis conducted on geographies consisting of 331,802,706 people shows a weak negative correlation between the proportion of Native Hawaiians and median household income in the United States with a correlation coefficient (R) of -0.276 and weighted average of $89,919, a difference of 9.3%.
Median Household Income Correlation Summary
| Measurement | Vietnamese | Native Hawaiian |
| Minimum | $36,578 | $18,739 |
| Maximum | $143,859 | $137,302 |
| Range | $107,281 | $118,563 |
| Mean | $84,974 | $86,036 |
| Median | $84,533 | $87,089 |
| Interquartile 25% (IQ1) | $71,810 | $73,233 |
| Interquartile 75% (IQ3) | $98,943 | $104,035 |
| Interquartile Range (IQR) | $27,134 | $30,802 |
| Standard Deviation (Sample) | $23,335 | $23,037 |
| Standard Deviation (Population) | $23,181 | $22,935 |
Similar Demographics by Median Household Income
Demographics Similar to Vietnamese by Median Household Income
In terms of median household income, the demographic groups most similar to Vietnamese are Panamanian ($82,272, a difference of 0.030%), Yugoslavian ($82,186, a difference of 0.070%), Nepalese ($82,410, a difference of 0.20%), Venezuelan ($82,432, a difference of 0.22%), and Ecuadorian ($82,070, a difference of 0.22%).
| Demographics | Rating | Rank | Median Household Income |
| French Canadians | 18.7 /100 | #208 | Poor $82,810 |
| Immigrants | Iraq | 16.7 /100 | #209 | Poor $82,594 |
| Immigrants | Uruguay | 16.4 /100 | #210 | Poor $82,560 |
| Salvadorans | 15.4 /100 | #211 | Poor $82,449 |
| Venezuelans | 15.3 /100 | #212 | Poor $82,432 |
| Nepalese | 15.1 /100 | #213 | Poor $82,410 |
| Panamanians | 14.0 /100 | #214 | Poor $82,272 |
| Vietnamese | 13.8 /100 | #215 | Poor $82,248 |
| Yugoslavians | 13.3 /100 | #216 | Poor $82,186 |
| Ecuadorians | 12.5 /100 | #217 | Poor $82,070 |
| Whites/Caucasians | 12.2 /100 | #218 | Poor $82,029 |
| Nigerians | 10.3 /100 | #219 | Poor $81,725 |
| Immigrants | Venezuela | 9.0 /100 | #220 | Tragic $81,506 |
| Immigrants | Ghana | 9.0 /100 | #221 | Tragic $81,489 |
| Immigrants | Nigeria | 7.7 /100 | #222 | Tragic $81,236 |
Demographics Similar to Native Hawaiians by Median Household Income
In terms of median household income, the demographic groups most similar to Native Hawaiians are Taiwanese ($89,900, a difference of 0.020%), Immigrants from Western Asia ($90,005, a difference of 0.10%), Syrian ($89,830, a difference of 0.10%), Immigrants from Northern Africa ($90,026, a difference of 0.12%), and Albanian ($89,744, a difference of 0.20%).
| Demographics | Rating | Rank | Median Household Income |
| Chileans | 97.2 /100 | #109 | Exceptional $90,605 |
| Palestinians | 97.1 /100 | #110 | Exceptional $90,574 |
| Immigrants | Poland | 97.1 /100 | #111 | Exceptional $90,549 |
| Northern Europeans | 96.9 /100 | #112 | Exceptional $90,446 |
| Peruvians | 96.5 /100 | #113 | Exceptional $90,261 |
| Immigrants | Northern Africa | 95.9 /100 | #114 | Exceptional $90,026 |
| Immigrants | Western Asia | 95.9 /100 | #115 | Exceptional $90,005 |
| Native Hawaiians | 95.7 /100 | #116 | Exceptional $89,919 |
| Taiwanese | 95.6 /100 | #117 | Exceptional $89,900 |
| Syrians | 95.4 /100 | #118 | Exceptional $89,830 |
| Albanians | 95.2 /100 | #119 | Exceptional $89,744 |
| Immigrants | North Macedonia | 95.2 /100 | #120 | Exceptional $89,741 |
| Ethiopians | 94.9 /100 | #121 | Exceptional $89,640 |
| Pakistanis | 94.8 /100 | #122 | Exceptional $89,638 |
| Immigrants | Zimbabwe | 94.4 /100 | #123 | Exceptional $89,496 |