Jordanian vs Immigrants from Latvia Median Household Income
COMPARE
Jordanian
Immigrants from Latvia
Median Household Income
Median Household Income Comparison
Jordanians
Immigrants from Latvia
$91,794
MEDIAN HOUSEHOLD INCOME
98.7/ 100
METRIC RATING
96th/ 347
METRIC RANK
$93,602
MEDIAN HOUSEHOLD INCOME
99.6/ 100
METRIC RATING
74th/ 347
METRIC RANK
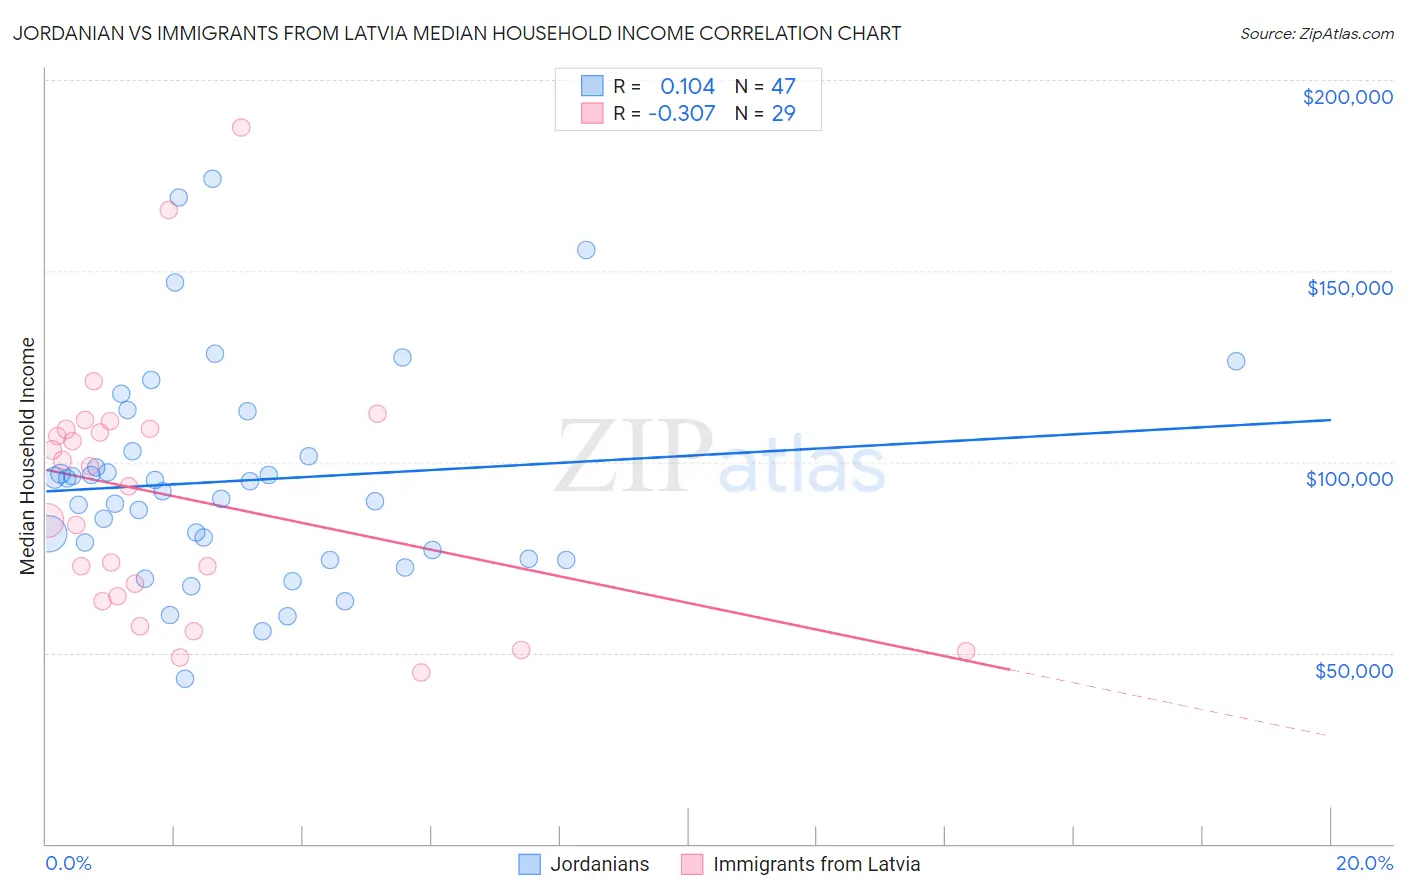
Jordanian vs Immigrants from Latvia Median Household Income Correlation Chart
The statistical analysis conducted on geographies consisting of 166,374,087 people shows a poor positive correlation between the proportion of Jordanians and median household income in the United States with a correlation coefficient (R) of 0.104 and weighted average of $91,794. Similarly, the statistical analysis conducted on geographies consisting of 113,726,313 people shows a mild negative correlation between the proportion of Immigrants from Latvia and median household income in the United States with a correlation coefficient (R) of -0.307 and weighted average of $93,602, a difference of 2.0%.
Median Household Income Correlation Summary
| Measurement | Jordanian | Immigrants from Latvia |
| Minimum | $43,214 | $44,737 |
| Maximum | $174,260 | $187,593 |
| Range | $131,046 | $142,856 |
| Mean | $95,049 | $90,790 |
| Median | $92,429 | $93,558 |
| Interquartile 25% (IQ1) | $74,643 | $64,215 |
| Interquartile 75% (IQ3) | $102,895 | $108,638 |
| Interquartile Range (IQR) | $28,252 | $44,423 |
| Standard Deviation (Sample) | $28,123 | $33,495 |
| Standard Deviation (Population) | $27,822 | $32,912 |
Similar Demographics by Median Household Income
Demographics Similar to Jordanians by Median Household Income
In terms of median household income, the demographic groups most similar to Jordanians are Armenian ($91,807, a difference of 0.010%), Immigrants from North America ($91,860, a difference of 0.070%), Immigrants from Serbia ($91,730, a difference of 0.070%), Immigrants from Lebanon ($91,887, a difference of 0.10%), and Immigrants from Western Europe ($91,936, a difference of 0.15%).
| Demographics | Rating | Rank | Median Household Income |
| Romanians | 98.8 /100 | #89 | Exceptional $91,994 |
| Assyrians/Chaldeans/Syriacs | 98.8 /100 | #90 | Exceptional $91,991 |
| Immigrants | Vietnam | 98.8 /100 | #91 | Exceptional $91,987 |
| Immigrants | Western Europe | 98.8 /100 | #92 | Exceptional $91,936 |
| Immigrants | Lebanon | 98.7 /100 | #93 | Exceptional $91,887 |
| Immigrants | North America | 98.7 /100 | #94 | Exceptional $91,860 |
| Armenians | 98.7 /100 | #95 | Exceptional $91,807 |
| Jordanians | 98.7 /100 | #96 | Exceptional $91,794 |
| Immigrants | Serbia | 98.6 /100 | #97 | Exceptional $91,730 |
| Immigrants | Southern Europe | 98.5 /100 | #98 | Exceptional $91,605 |
| Immigrants | South Eastern Asia | 98.4 /100 | #99 | Exceptional $91,541 |
| Ukrainians | 98.3 /100 | #100 | Exceptional $91,456 |
| Immigrants | Moldova | 98.3 /100 | #101 | Exceptional $91,446 |
| Austrians | 98.2 /100 | #102 | Exceptional $91,339 |
| Immigrants | Ukraine | 98.0 /100 | #103 | Exceptional $91,124 |
Demographics Similar to Immigrants from Latvia by Median Household Income
In terms of median household income, the demographic groups most similar to Immigrants from Latvia are Immigrants from Egypt ($93,700, a difference of 0.10%), Immigrants from Italy ($93,465, a difference of 0.15%), South African ($93,379, a difference of 0.24%), Immigrants from Afghanistan ($93,375, a difference of 0.24%), and Lithuanian ($93,852, a difference of 0.27%).
| Demographics | Rating | Rank | Median Household Income |
| Immigrants | Scotland | 99.7 /100 | #67 | Exceptional $94,091 |
| Mongolians | 99.7 /100 | #68 | Exceptional $93,971 |
| Argentineans | 99.7 /100 | #69 | Exceptional $93,960 |
| Immigrants | Fiji | 99.7 /100 | #70 | Exceptional $93,933 |
| Immigrants | Philippines | 99.6 /100 | #71 | Exceptional $93,899 |
| Lithuanians | 99.6 /100 | #72 | Exceptional $93,852 |
| Immigrants | Egypt | 99.6 /100 | #73 | Exceptional $93,700 |
| Immigrants | Latvia | 99.6 /100 | #74 | Exceptional $93,602 |
| Immigrants | Italy | 99.5 /100 | #75 | Exceptional $93,465 |
| South Africans | 99.5 /100 | #76 | Exceptional $93,379 |
| Immigrants | Afghanistan | 99.5 /100 | #77 | Exceptional $93,375 |
| Immigrants | Bulgaria | 99.4 /100 | #78 | Exceptional $93,148 |
| Sri Lankans | 99.4 /100 | #79 | Exceptional $93,093 |
| Tongans | 99.4 /100 | #80 | Exceptional $93,076 |
| Immigrants | Eastern Europe | 99.4 /100 | #81 | Exceptional $93,051 |