Turkish vs Immigrants from West Indies Median Earnings
COMPARE
Turkish
Immigrants from West Indies
Median Earnings
Median Earnings Comparison
Turks
Immigrants from West Indies
$53,919
MEDIAN EARNINGS
100.0/ 100
METRIC RATING
25th/ 347
METRIC RANK
$43,989
MEDIAN EARNINGS
3.1/ 100
METRIC RATING
246th/ 347
METRIC RANK
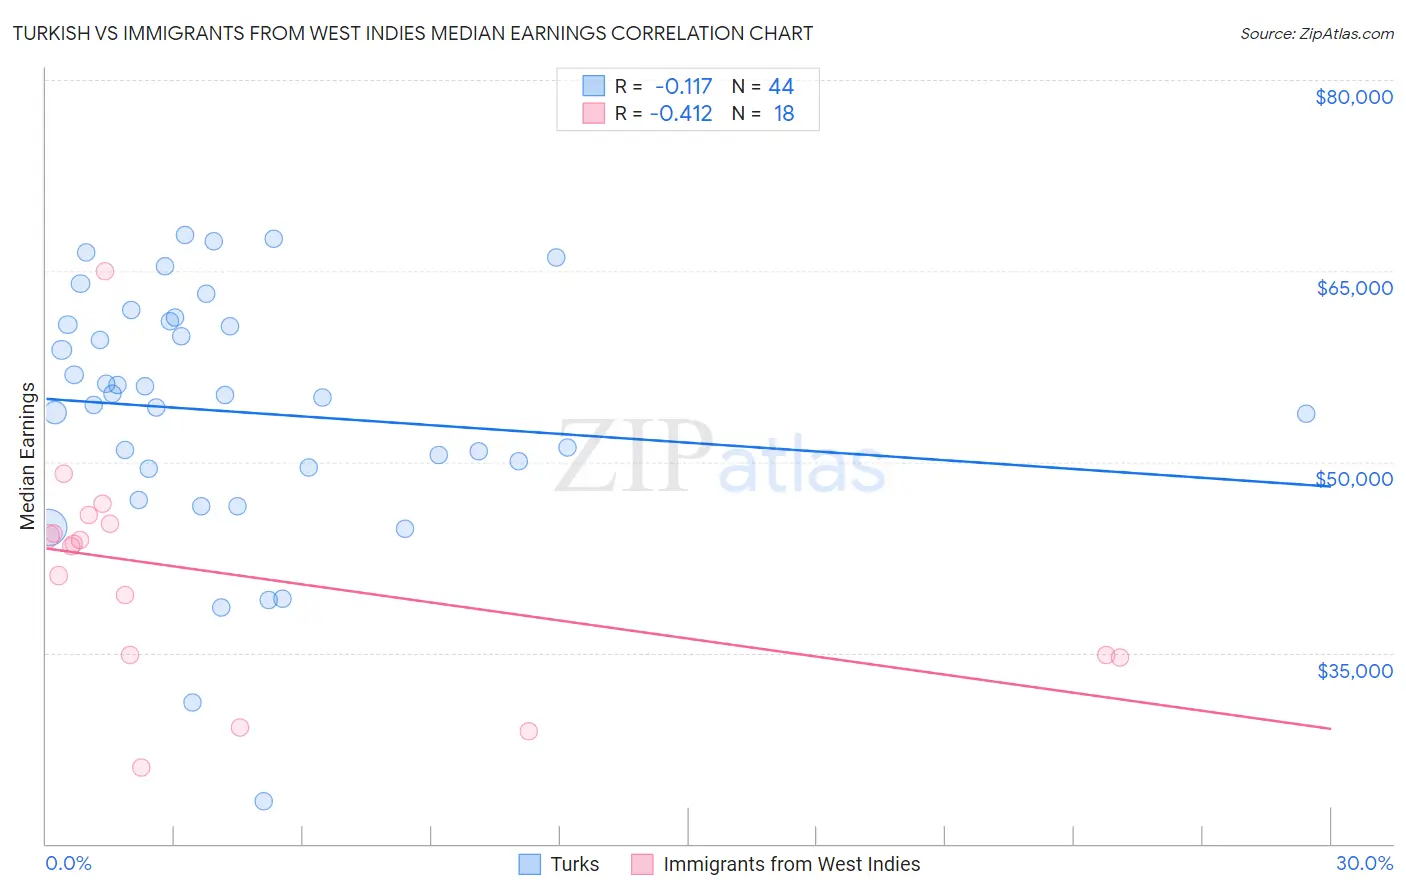
Turkish vs Immigrants from West Indies Median Earnings Correlation Chart
The statistical analysis conducted on geographies consisting of 271,840,547 people shows a poor negative correlation between the proportion of Turks and median earnings in the United States with a correlation coefficient (R) of -0.117 and weighted average of $53,919. Similarly, the statistical analysis conducted on geographies consisting of 72,420,477 people shows a moderate negative correlation between the proportion of Immigrants from West Indies and median earnings in the United States with a correlation coefficient (R) of -0.412 and weighted average of $43,989, a difference of 22.6%.
Median Earnings Correlation Summary
| Measurement | Turkish | Immigrants from West Indies |
| Minimum | $23,333 | $26,000 |
| Maximum | $67,805 | $64,982 |
| Range | $44,472 | $38,982 |
| Mean | $53,919 | $41,111 |
| Median | $55,155 | $43,487 |
| Interquartile 25% (IQ1) | $49,523 | $34,810 |
| Interquartile 75% (IQ3) | $60,942 | $45,119 |
| Interquartile Range (IQR) | $11,419 | $10,309 |
| Standard Deviation (Sample) | $9,775 | $9,035 |
| Standard Deviation (Population) | $9,664 | $8,780 |
Similar Demographics by Median Earnings
Demographics Similar to Turks by Median Earnings
In terms of median earnings, the demographic groups most similar to Turks are Immigrants from Northern Europe ($53,872, a difference of 0.090%), Asian ($53,690, a difference of 0.43%), Soviet Union ($54,290, a difference of 0.69%), Immigrants from France ($53,490, a difference of 0.80%), and Immigrants from Russia ($53,457, a difference of 0.86%).
| Demographics | Rating | Rank | Median Earnings |
| Immigrants | Japan | 100.0 /100 | #18 | Exceptional $54,938 |
| Immigrants | Belgium | 100.0 /100 | #19 | Exceptional $54,679 |
| Cypriots | 100.0 /100 | #20 | Exceptional $54,589 |
| Burmese | 100.0 /100 | #21 | Exceptional $54,559 |
| Immigrants | Korea | 100.0 /100 | #22 | Exceptional $54,530 |
| Immigrants | Sweden | 100.0 /100 | #23 | Exceptional $54,478 |
| Soviet Union | 100.0 /100 | #24 | Exceptional $54,290 |
| Turks | 100.0 /100 | #25 | Exceptional $53,919 |
| Immigrants | Northern Europe | 100.0 /100 | #26 | Exceptional $53,872 |
| Asians | 100.0 /100 | #27 | Exceptional $53,690 |
| Immigrants | France | 100.0 /100 | #28 | Exceptional $53,490 |
| Immigrants | Russia | 100.0 /100 | #29 | Exceptional $53,457 |
| Cambodians | 100.0 /100 | #30 | Exceptional $53,386 |
| Russians | 100.0 /100 | #31 | Exceptional $53,334 |
| Immigrants | Asia | 100.0 /100 | #32 | Exceptional $53,310 |
Demographics Similar to Immigrants from West Indies by Median Earnings
In terms of median earnings, the demographic groups most similar to Immigrants from West Indies are Immigrants from Burma/Myanmar ($43,998, a difference of 0.020%), Immigrants from Cabo Verde ($43,963, a difference of 0.060%), Subsaharan African ($44,118, a difference of 0.29%), Nonimmigrants ($44,117, a difference of 0.29%), and Nepalese ($43,860, a difference of 0.29%).
| Demographics | Rating | Rank | Median Earnings |
| Senegalese | 5.3 /100 | #239 | Tragic $44,373 |
| Aleuts | 4.4 /100 | #240 | Tragic $44,241 |
| Samoans | 4.2 /100 | #241 | Tragic $44,206 |
| Immigrants | Venezuela | 4.0 /100 | #242 | Tragic $44,163 |
| Sub-Saharan Africans | 3.7 /100 | #243 | Tragic $44,118 |
| Immigrants | Nonimmigrants | 3.7 /100 | #244 | Tragic $44,117 |
| Immigrants | Burma/Myanmar | 3.2 /100 | #245 | Tragic $43,998 |
| Immigrants | West Indies | 3.1 /100 | #246 | Tragic $43,989 |
| Immigrants | Cabo Verde | 3.0 /100 | #247 | Tragic $43,963 |
| Nepalese | 2.6 /100 | #248 | Tragic $43,860 |
| Malaysians | 2.6 /100 | #249 | Tragic $43,844 |
| Alaska Natives | 2.3 /100 | #250 | Tragic $43,750 |
| Tsimshian | 2.1 /100 | #251 | Tragic $43,695 |
| Hawaiians | 2.0 /100 | #252 | Tragic $43,673 |
| Somalis | 1.8 /100 | #253 | Tragic $43,567 |