Yuman vs Immigrants from West Indies Median Earnings
COMPARE
Yuman
Immigrants from West Indies
Median Earnings
Median Earnings Comparison
Yuman
Immigrants from West Indies
$39,523
MEDIAN EARNINGS
0.0/ 100
METRIC RATING
327th/ 347
METRIC RANK
$43,989
MEDIAN EARNINGS
3.1/ 100
METRIC RATING
246th/ 347
METRIC RANK
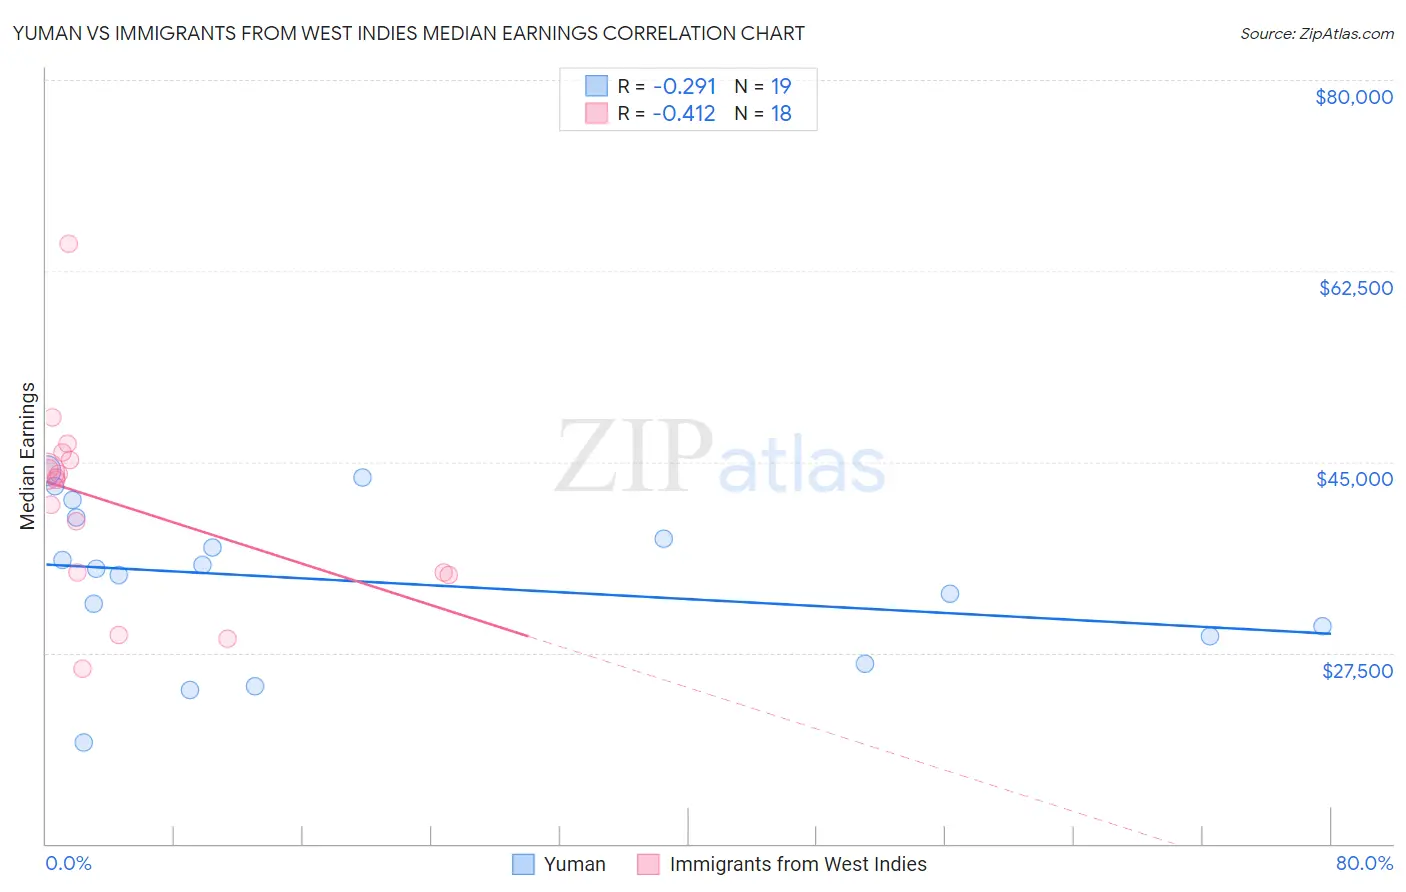
Yuman vs Immigrants from West Indies Median Earnings Correlation Chart
The statistical analysis conducted on geographies consisting of 40,694,380 people shows a weak negative correlation between the proportion of Yuman and median earnings in the United States with a correlation coefficient (R) of -0.291 and weighted average of $39,523. Similarly, the statistical analysis conducted on geographies consisting of 72,420,477 people shows a moderate negative correlation between the proportion of Immigrants from West Indies and median earnings in the United States with a correlation coefficient (R) of -0.412 and weighted average of $43,989, a difference of 11.3%.
Median Earnings Correlation Summary
| Measurement | Yuman | Immigrants from West Indies |
| Minimum | $19,239 | $26,000 |
| Maximum | $44,204 | $64,982 |
| Range | $24,965 | $38,982 |
| Mean | $34,023 | $41,111 |
| Median | $35,154 | $43,487 |
| Interquartile 25% (IQ1) | $29,007 | $34,810 |
| Interquartile 75% (IQ3) | $39,859 | $45,119 |
| Interquartile Range (IQR) | $10,852 | $10,309 |
| Standard Deviation (Sample) | $7,101 | $9,035 |
| Standard Deviation (Population) | $6,912 | $8,780 |
Similar Demographics by Median Earnings
Demographics Similar to Yuman by Median Earnings
In terms of median earnings, the demographic groups most similar to Yuman are Immigrants from Yemen ($39,540, a difference of 0.040%), Sioux ($39,448, a difference of 0.19%), Creek ($39,648, a difference of 0.32%), Ottawa ($39,721, a difference of 0.50%), and Bahamian ($39,735, a difference of 0.54%).
| Demographics | Rating | Rank | Median Earnings |
| Immigrants | Bahamas | 0.0 /100 | #320 | Tragic $39,861 |
| Mexicans | 0.0 /100 | #321 | Tragic $39,834 |
| Immigrants | Central America | 0.0 /100 | #322 | Tragic $39,762 |
| Bahamians | 0.0 /100 | #323 | Tragic $39,735 |
| Ottawa | 0.0 /100 | #324 | Tragic $39,721 |
| Creek | 0.0 /100 | #325 | Tragic $39,648 |
| Immigrants | Yemen | 0.0 /100 | #326 | Tragic $39,540 |
| Yuman | 0.0 /100 | #327 | Tragic $39,523 |
| Sioux | 0.0 /100 | #328 | Tragic $39,448 |
| Kiowa | 0.0 /100 | #329 | Tragic $39,232 |
| Immigrants | Congo | 0.0 /100 | #330 | Tragic $39,169 |
| Immigrants | Mexico | 0.0 /100 | #331 | Tragic $39,114 |
| Yakama | 0.0 /100 | #332 | Tragic $39,107 |
| Houma | 0.0 /100 | #333 | Tragic $38,949 |
| Spanish American Indians | 0.0 /100 | #334 | Tragic $38,907 |
Demographics Similar to Immigrants from West Indies by Median Earnings
In terms of median earnings, the demographic groups most similar to Immigrants from West Indies are Immigrants from Burma/Myanmar ($43,998, a difference of 0.020%), Immigrants from Cabo Verde ($43,963, a difference of 0.060%), Subsaharan African ($44,118, a difference of 0.29%), Nonimmigrants ($44,117, a difference of 0.29%), and Nepalese ($43,860, a difference of 0.29%).
| Demographics | Rating | Rank | Median Earnings |
| Senegalese | 5.3 /100 | #239 | Tragic $44,373 |
| Aleuts | 4.4 /100 | #240 | Tragic $44,241 |
| Samoans | 4.2 /100 | #241 | Tragic $44,206 |
| Immigrants | Venezuela | 4.0 /100 | #242 | Tragic $44,163 |
| Sub-Saharan Africans | 3.7 /100 | #243 | Tragic $44,118 |
| Immigrants | Nonimmigrants | 3.7 /100 | #244 | Tragic $44,117 |
| Immigrants | Burma/Myanmar | 3.2 /100 | #245 | Tragic $43,998 |
| Immigrants | West Indies | 3.1 /100 | #246 | Tragic $43,989 |
| Immigrants | Cabo Verde | 3.0 /100 | #247 | Tragic $43,963 |
| Nepalese | 2.6 /100 | #248 | Tragic $43,860 |
| Malaysians | 2.6 /100 | #249 | Tragic $43,844 |
| Alaska Natives | 2.3 /100 | #250 | Tragic $43,750 |
| Tsimshian | 2.1 /100 | #251 | Tragic $43,695 |
| Hawaiians | 2.0 /100 | #252 | Tragic $43,673 |
| Somalis | 1.8 /100 | #253 | Tragic $43,567 |