Immigrants from Laos vs Immigrants from West Indies Median Earnings
COMPARE
Immigrants from Laos
Immigrants from West Indies
Median Earnings
Median Earnings Comparison
Immigrants from Laos
Immigrants from West Indies
$42,884
MEDIAN EARNINGS
0.7/ 100
METRIC RATING
266th/ 347
METRIC RANK
$43,989
MEDIAN EARNINGS
3.1/ 100
METRIC RATING
246th/ 347
METRIC RANK
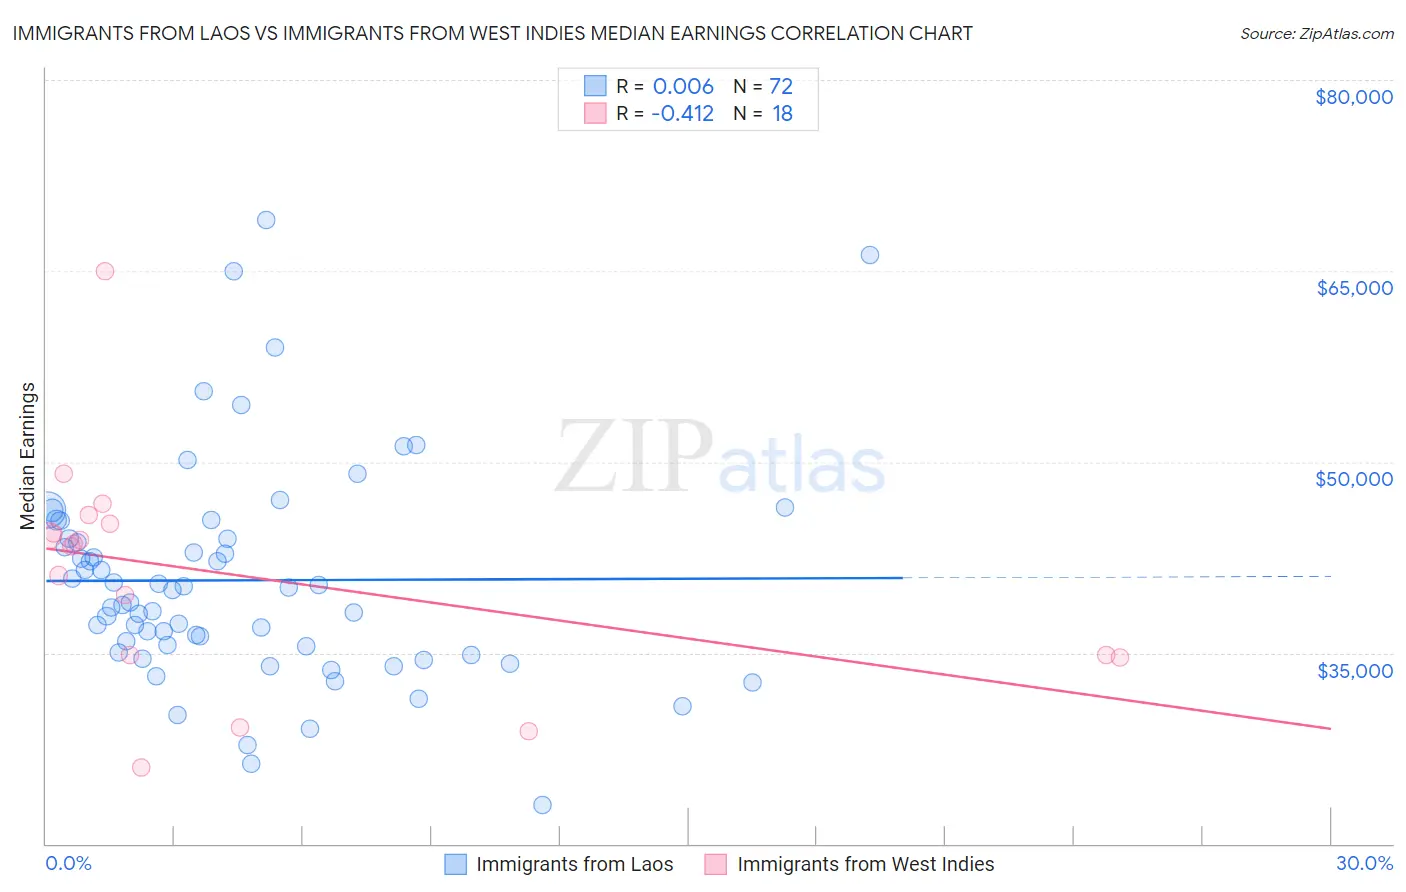
Immigrants from Laos vs Immigrants from West Indies Median Earnings Correlation Chart
The statistical analysis conducted on geographies consisting of 201,460,807 people shows no correlation between the proportion of Immigrants from Laos and median earnings in the United States with a correlation coefficient (R) of 0.006 and weighted average of $42,884. Similarly, the statistical analysis conducted on geographies consisting of 72,420,477 people shows a moderate negative correlation between the proportion of Immigrants from West Indies and median earnings in the United States with a correlation coefficient (R) of -0.412 and weighted average of $43,989, a difference of 2.6%.
Median Earnings Correlation Summary
| Measurement | Immigrants from Laos | Immigrants from West Indies |
| Minimum | $23,015 | $26,000 |
| Maximum | $69,036 | $64,982 |
| Range | $46,021 | $38,982 |
| Mean | $40,698 | $41,111 |
| Median | $39,398 | $43,487 |
| Interquartile 25% (IQ1) | $35,289 | $34,810 |
| Interquartile 75% (IQ3) | $43,967 | $45,119 |
| Interquartile Range (IQR) | $8,679 | $10,309 |
| Standard Deviation (Sample) | $8,643 | $9,035 |
| Standard Deviation (Population) | $8,583 | $8,780 |
Demographics Similar to Immigrants from Laos and Immigrants from West Indies by Median Earnings
In terms of median earnings, the demographic groups most similar to Immigrants from Laos are Salvadoran ($42,912, a difference of 0.060%), Immigrants from Liberia ($42,923, a difference of 0.090%), Inupiat ($43,000, a difference of 0.27%), Immigrants from Jamaica ($43,026, a difference of 0.33%), and Nicaraguan ($43,026, a difference of 0.33%). Similarly, the demographic groups most similar to Immigrants from West Indies are Immigrants from Cabo Verde ($43,963, a difference of 0.060%), Nepalese ($43,860, a difference of 0.29%), Malaysian ($43,844, a difference of 0.33%), Alaska Native ($43,750, a difference of 0.55%), and Tsimshian ($43,695, a difference of 0.67%).
| Demographics | Rating | Rank | Median Earnings |
| Immigrants | West Indies | 3.1 /100 | #246 | Tragic $43,989 |
| Immigrants | Cabo Verde | 3.0 /100 | #247 | Tragic $43,963 |
| Nepalese | 2.6 /100 | #248 | Tragic $43,860 |
| Malaysians | 2.6 /100 | #249 | Tragic $43,844 |
| Alaska Natives | 2.3 /100 | #250 | Tragic $43,750 |
| Tsimshian | 2.1 /100 | #251 | Tragic $43,695 |
| Hawaiians | 2.0 /100 | #252 | Tragic $43,673 |
| Somalis | 1.8 /100 | #253 | Tragic $43,567 |
| Liberians | 1.7 /100 | #254 | Tragic $43,536 |
| Immigrants | Middle Africa | 1.4 /100 | #255 | Tragic $43,416 |
| Alaskan Athabascans | 1.4 /100 | #256 | Tragic $43,393 |
| Jamaicans | 1.3 /100 | #257 | Tragic $43,343 |
| French American Indians | 1.3 /100 | #258 | Tragic $43,333 |
| German Russians | 1.1 /100 | #259 | Tragic $43,200 |
| Immigrants | Somalia | 0.9 /100 | #260 | Tragic $43,100 |
| Immigrants | Jamaica | 0.8 /100 | #261 | Tragic $43,026 |
| Nicaraguans | 0.8 /100 | #262 | Tragic $43,026 |
| Inupiat | 0.8 /100 | #263 | Tragic $43,000 |
| Immigrants | Liberia | 0.7 /100 | #264 | Tragic $42,923 |
| Salvadorans | 0.7 /100 | #265 | Tragic $42,912 |
| Immigrants | Laos | 0.7 /100 | #266 | Tragic $42,884 |