Uruguayan vs Immigrants from West Indies Median Earnings
COMPARE
Uruguayan
Immigrants from West Indies
Median Earnings
Median Earnings Comparison
Uruguayans
Immigrants from West Indies
$46,190
MEDIAN EARNINGS
41.6/ 100
METRIC RATING
185th/ 347
METRIC RANK
$43,989
MEDIAN EARNINGS
3.1/ 100
METRIC RATING
246th/ 347
METRIC RANK
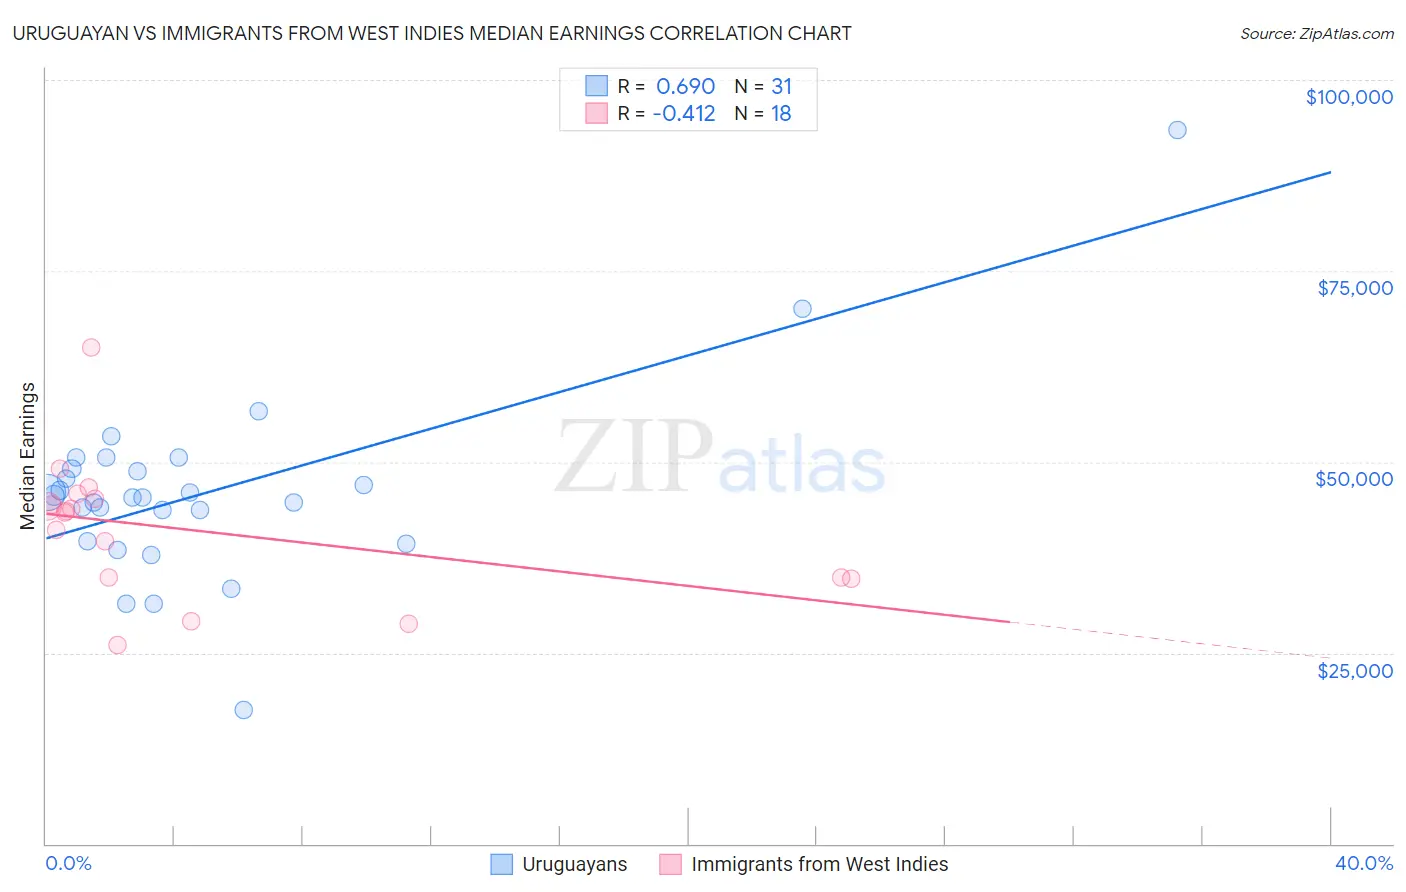
Uruguayan vs Immigrants from West Indies Median Earnings Correlation Chart
The statistical analysis conducted on geographies consisting of 144,784,894 people shows a significant positive correlation between the proportion of Uruguayans and median earnings in the United States with a correlation coefficient (R) of 0.690 and weighted average of $46,190. Similarly, the statistical analysis conducted on geographies consisting of 72,420,477 people shows a moderate negative correlation between the proportion of Immigrants from West Indies and median earnings in the United States with a correlation coefficient (R) of -0.412 and weighted average of $43,989, a difference of 5.0%.
Median Earnings Correlation Summary
| Measurement | Uruguayan | Immigrants from West Indies |
| Minimum | $17,500 | $26,000 |
| Maximum | $93,387 | $64,982 |
| Range | $75,887 | $38,982 |
| Mean | $45,994 | $41,111 |
| Median | $45,417 | $43,487 |
| Interquartile 25% (IQ1) | $39,561 | $34,810 |
| Interquartile 75% (IQ3) | $49,175 | $45,119 |
| Interquartile Range (IQR) | $9,613 | $10,309 |
| Standard Deviation (Sample) | $12,526 | $9,035 |
| Standard Deviation (Population) | $12,322 | $8,780 |
Similar Demographics by Median Earnings
Demographics Similar to Uruguayans by Median Earnings
In terms of median earnings, the demographic groups most similar to Uruguayans are Vietnamese ($46,172, a difference of 0.040%), Immigrants from Kenya ($46,214, a difference of 0.050%), Iraqi ($46,140, a difference of 0.11%), Immigrants from Armenia ($46,094, a difference of 0.21%), and French ($46,296, a difference of 0.23%).
| Demographics | Rating | Rank | Median Earnings |
| Colombians | 47.1 /100 | #178 | Average $46,349 |
| English | 46.5 /100 | #179 | Average $46,334 |
| Puget Sound Salish | 46.5 /100 | #180 | Average $46,333 |
| Immigrants | Cameroon | 46.4 /100 | #181 | Average $46,329 |
| Swiss | 45.9 /100 | #182 | Average $46,315 |
| French | 45.2 /100 | #183 | Average $46,296 |
| Immigrants | Kenya | 42.4 /100 | #184 | Average $46,214 |
| Uruguayans | 41.6 /100 | #185 | Average $46,190 |
| Vietnamese | 40.9 /100 | #186 | Average $46,172 |
| Iraqis | 39.9 /100 | #187 | Fair $46,140 |
| Immigrants | Armenia | 38.3 /100 | #188 | Fair $46,094 |
| Spaniards | 37.2 /100 | #189 | Fair $46,059 |
| French Canadians | 36.1 /100 | #190 | Fair $46,026 |
| Finns | 33.4 /100 | #191 | Fair $45,940 |
| Germans | 33.2 /100 | #192 | Fair $45,935 |
Demographics Similar to Immigrants from West Indies by Median Earnings
In terms of median earnings, the demographic groups most similar to Immigrants from West Indies are Immigrants from Burma/Myanmar ($43,998, a difference of 0.020%), Immigrants from Cabo Verde ($43,963, a difference of 0.060%), Subsaharan African ($44,118, a difference of 0.29%), Nonimmigrants ($44,117, a difference of 0.29%), and Nepalese ($43,860, a difference of 0.29%).
| Demographics | Rating | Rank | Median Earnings |
| Senegalese | 5.3 /100 | #239 | Tragic $44,373 |
| Aleuts | 4.4 /100 | #240 | Tragic $44,241 |
| Samoans | 4.2 /100 | #241 | Tragic $44,206 |
| Immigrants | Venezuela | 4.0 /100 | #242 | Tragic $44,163 |
| Sub-Saharan Africans | 3.7 /100 | #243 | Tragic $44,118 |
| Immigrants | Nonimmigrants | 3.7 /100 | #244 | Tragic $44,117 |
| Immigrants | Burma/Myanmar | 3.2 /100 | #245 | Tragic $43,998 |
| Immigrants | West Indies | 3.1 /100 | #246 | Tragic $43,989 |
| Immigrants | Cabo Verde | 3.0 /100 | #247 | Tragic $43,963 |
| Nepalese | 2.6 /100 | #248 | Tragic $43,860 |
| Malaysians | 2.6 /100 | #249 | Tragic $43,844 |
| Alaska Natives | 2.3 /100 | #250 | Tragic $43,750 |
| Tsimshian | 2.1 /100 | #251 | Tragic $43,695 |
| Hawaiians | 2.0 /100 | #252 | Tragic $43,673 |
| Somalis | 1.8 /100 | #253 | Tragic $43,567 |