Turkish vs Samoan Median Earnings
COMPARE
Turkish
Samoan
Median Earnings
Median Earnings Comparison
Turks
Samoans
$53,919
MEDIAN EARNINGS
100.0/ 100
METRIC RATING
25th/ 347
METRIC RANK
$44,206
MEDIAN EARNINGS
4.2/ 100
METRIC RATING
241st/ 347
METRIC RANK
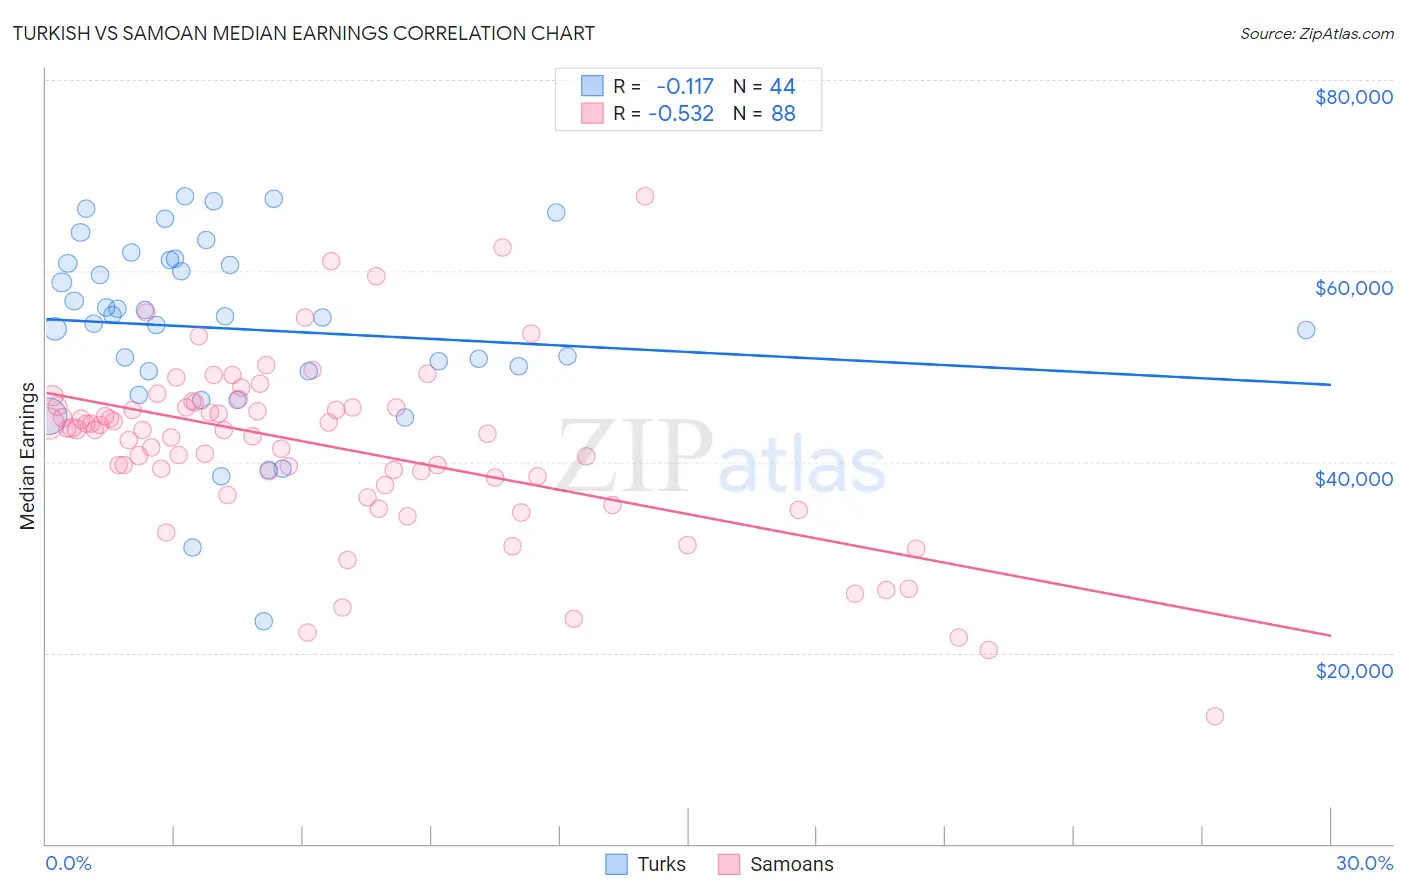
Turkish vs Samoan Median Earnings Correlation Chart
The statistical analysis conducted on geographies consisting of 271,840,547 people shows a poor negative correlation between the proportion of Turks and median earnings in the United States with a correlation coefficient (R) of -0.117 and weighted average of $53,919. Similarly, the statistical analysis conducted on geographies consisting of 225,197,093 people shows a substantial negative correlation between the proportion of Samoans and median earnings in the United States with a correlation coefficient (R) of -0.532 and weighted average of $44,206, a difference of 22.0%.
Median Earnings Correlation Summary
| Measurement | Turkish | Samoan |
| Minimum | $23,333 | $13,413 |
| Maximum | $67,805 | $67,875 |
| Range | $44,472 | $54,462 |
| Mean | $53,919 | $41,589 |
| Median | $55,155 | $43,332 |
| Interquartile 25% (IQ1) | $49,523 | $37,950 |
| Interquartile 75% (IQ3) | $60,942 | $45,824 |
| Interquartile Range (IQR) | $11,419 | $7,874 |
| Standard Deviation (Sample) | $9,775 | $9,289 |
| Standard Deviation (Population) | $9,664 | $9,236 |
Similar Demographics by Median Earnings
Demographics Similar to Turks by Median Earnings
In terms of median earnings, the demographic groups most similar to Turks are Immigrants from Northern Europe ($53,872, a difference of 0.090%), Asian ($53,690, a difference of 0.43%), Soviet Union ($54,290, a difference of 0.69%), Immigrants from France ($53,490, a difference of 0.80%), and Immigrants from Russia ($53,457, a difference of 0.86%).
| Demographics | Rating | Rank | Median Earnings |
| Immigrants | Japan | 100.0 /100 | #18 | Exceptional $54,938 |
| Immigrants | Belgium | 100.0 /100 | #19 | Exceptional $54,679 |
| Cypriots | 100.0 /100 | #20 | Exceptional $54,589 |
| Burmese | 100.0 /100 | #21 | Exceptional $54,559 |
| Immigrants | Korea | 100.0 /100 | #22 | Exceptional $54,530 |
| Immigrants | Sweden | 100.0 /100 | #23 | Exceptional $54,478 |
| Soviet Union | 100.0 /100 | #24 | Exceptional $54,290 |
| Turks | 100.0 /100 | #25 | Exceptional $53,919 |
| Immigrants | Northern Europe | 100.0 /100 | #26 | Exceptional $53,872 |
| Asians | 100.0 /100 | #27 | Exceptional $53,690 |
| Immigrants | France | 100.0 /100 | #28 | Exceptional $53,490 |
| Immigrants | Russia | 100.0 /100 | #29 | Exceptional $53,457 |
| Cambodians | 100.0 /100 | #30 | Exceptional $53,386 |
| Russians | 100.0 /100 | #31 | Exceptional $53,334 |
| Immigrants | Asia | 100.0 /100 | #32 | Exceptional $53,310 |
Demographics Similar to Samoans by Median Earnings
In terms of median earnings, the demographic groups most similar to Samoans are Aleut ($44,241, a difference of 0.080%), Immigrants from Venezuela ($44,163, a difference of 0.10%), Subsaharan African ($44,118, a difference of 0.20%), Nonimmigrants ($44,117, a difference of 0.20%), and Senegalese ($44,373, a difference of 0.38%).
| Demographics | Rating | Rank | Median Earnings |
| Cape Verdeans | 7.5 /100 | #234 | Tragic $44,640 |
| Venezuelans | 6.9 /100 | #235 | Tragic $44,580 |
| British West Indians | 6.7 /100 | #236 | Tragic $44,552 |
| Immigrants | Ecuador | 5.9 /100 | #237 | Tragic $44,462 |
| Sudanese | 5.6 /100 | #238 | Tragic $44,419 |
| Senegalese | 5.3 /100 | #239 | Tragic $44,373 |
| Aleuts | 4.4 /100 | #240 | Tragic $44,241 |
| Samoans | 4.2 /100 | #241 | Tragic $44,206 |
| Immigrants | Venezuela | 4.0 /100 | #242 | Tragic $44,163 |
| Sub-Saharan Africans | 3.7 /100 | #243 | Tragic $44,118 |
| Immigrants | Nonimmigrants | 3.7 /100 | #244 | Tragic $44,117 |
| Immigrants | Burma/Myanmar | 3.2 /100 | #245 | Tragic $43,998 |
| Immigrants | West Indies | 3.1 /100 | #246 | Tragic $43,989 |
| Immigrants | Cabo Verde | 3.0 /100 | #247 | Tragic $43,963 |
| Nepalese | 2.6 /100 | #248 | Tragic $43,860 |