Albanian vs Immigrants from West Indies Median Earnings
COMPARE
Albanian
Immigrants from West Indies
Median Earnings
Median Earnings Comparison
Albanians
Immigrants from West Indies
$50,116
MEDIAN EARNINGS
99.4/ 100
METRIC RATING
88th/ 347
METRIC RANK
$43,989
MEDIAN EARNINGS
3.1/ 100
METRIC RATING
246th/ 347
METRIC RANK
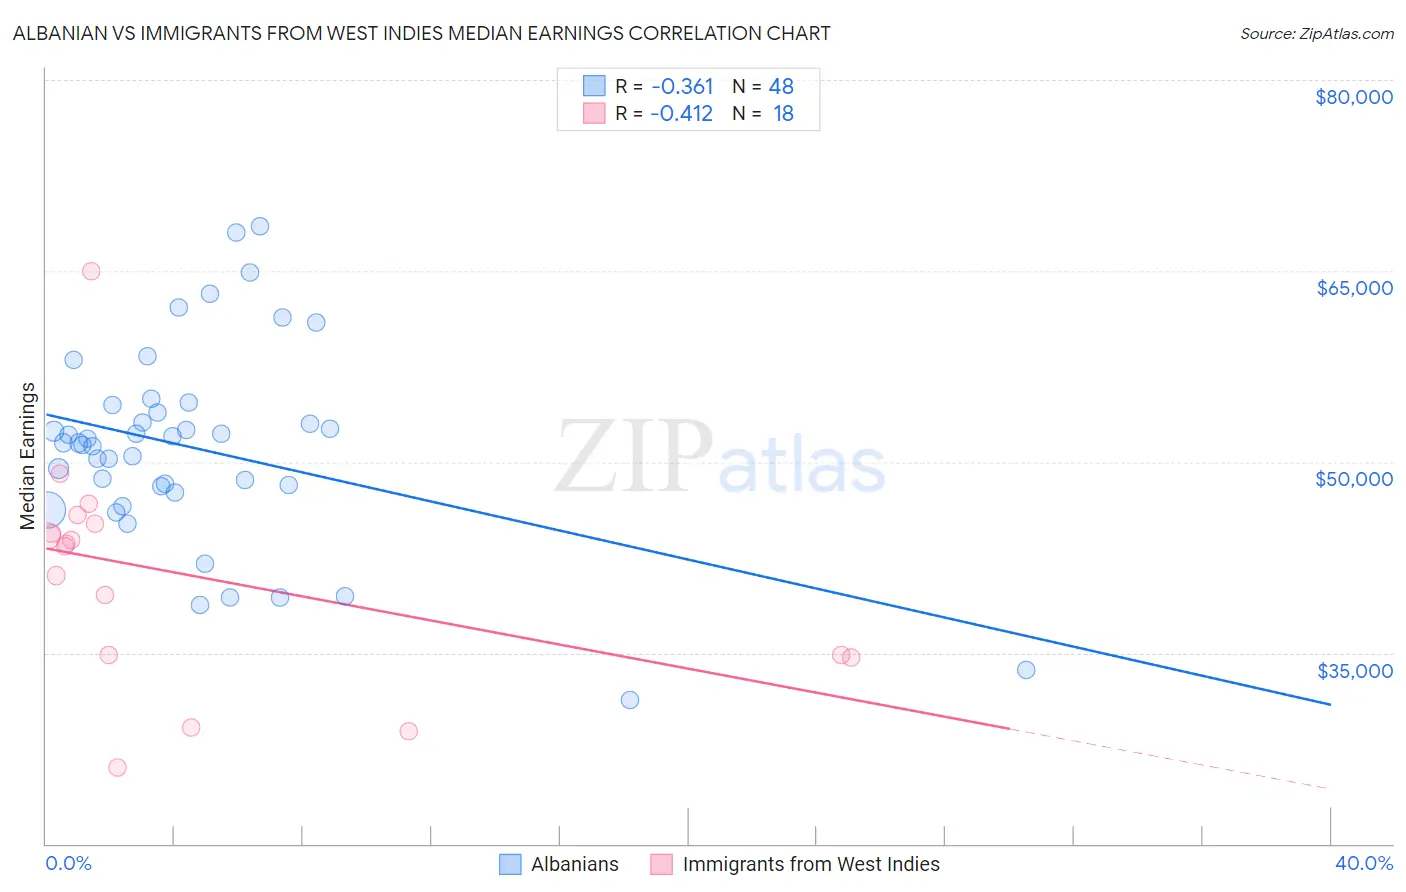
Albanian vs Immigrants from West Indies Median Earnings Correlation Chart
The statistical analysis conducted on geographies consisting of 193,255,601 people shows a mild negative correlation between the proportion of Albanians and median earnings in the United States with a correlation coefficient (R) of -0.361 and weighted average of $50,116. Similarly, the statistical analysis conducted on geographies consisting of 72,420,477 people shows a moderate negative correlation between the proportion of Immigrants from West Indies and median earnings in the United States with a correlation coefficient (R) of -0.412 and weighted average of $43,989, a difference of 13.9%.
Median Earnings Correlation Summary
| Measurement | Albanian | Immigrants from West Indies |
| Minimum | $31,250 | $26,000 |
| Maximum | $68,474 | $64,982 |
| Range | $37,224 | $38,982 |
| Mean | $51,050 | $41,111 |
| Median | $51,491 | $43,487 |
| Interquartile 25% (IQ1) | $47,850 | $34,810 |
| Interquartile 75% (IQ3) | $54,177 | $45,119 |
| Interquartile Range (IQR) | $6,327 | $10,309 |
| Standard Deviation (Sample) | $7,882 | $9,035 |
| Standard Deviation (Population) | $7,799 | $8,780 |
Similar Demographics by Median Earnings
Demographics Similar to Albanians by Median Earnings
In terms of median earnings, the demographic groups most similar to Albanians are Immigrants from North America ($50,108, a difference of 0.020%), Immigrants from Uzbekistan ($50,151, a difference of 0.070%), Immigrants from Canada ($50,192, a difference of 0.15%), Immigrants from Hungary ($50,227, a difference of 0.22%), and Immigrants from Kazakhstan ($50,225, a difference of 0.22%).
| Demographics | Rating | Rank | Median Earnings |
| Immigrants | Southern Europe | 99.6 /100 | #81 | Exceptional $50,280 |
| Immigrants | Moldova | 99.5 /100 | #82 | Exceptional $50,274 |
| Romanians | 99.5 /100 | #83 | Exceptional $50,244 |
| Immigrants | Hungary | 99.5 /100 | #84 | Exceptional $50,227 |
| Immigrants | Kazakhstan | 99.5 /100 | #85 | Exceptional $50,225 |
| Immigrants | Canada | 99.5 /100 | #86 | Exceptional $50,192 |
| Immigrants | Uzbekistan | 99.5 /100 | #87 | Exceptional $50,151 |
| Albanians | 99.4 /100 | #88 | Exceptional $50,116 |
| Immigrants | North America | 99.4 /100 | #89 | Exceptional $50,108 |
| Italians | 99.3 /100 | #90 | Exceptional $49,915 |
| Macedonians | 99.2 /100 | #91 | Exceptional $49,893 |
| Immigrants | Argentina | 99.2 /100 | #92 | Exceptional $49,841 |
| Armenians | 99.1 /100 | #93 | Exceptional $49,804 |
| Croatians | 99.0 /100 | #94 | Exceptional $49,724 |
| Immigrants | England | 99.0 /100 | #95 | Exceptional $49,722 |
Demographics Similar to Immigrants from West Indies by Median Earnings
In terms of median earnings, the demographic groups most similar to Immigrants from West Indies are Immigrants from Burma/Myanmar ($43,998, a difference of 0.020%), Immigrants from Cabo Verde ($43,963, a difference of 0.060%), Subsaharan African ($44,118, a difference of 0.29%), Nonimmigrants ($44,117, a difference of 0.29%), and Nepalese ($43,860, a difference of 0.29%).
| Demographics | Rating | Rank | Median Earnings |
| Senegalese | 5.3 /100 | #239 | Tragic $44,373 |
| Aleuts | 4.4 /100 | #240 | Tragic $44,241 |
| Samoans | 4.2 /100 | #241 | Tragic $44,206 |
| Immigrants | Venezuela | 4.0 /100 | #242 | Tragic $44,163 |
| Sub-Saharan Africans | 3.7 /100 | #243 | Tragic $44,118 |
| Immigrants | Nonimmigrants | 3.7 /100 | #244 | Tragic $44,117 |
| Immigrants | Burma/Myanmar | 3.2 /100 | #245 | Tragic $43,998 |
| Immigrants | West Indies | 3.1 /100 | #246 | Tragic $43,989 |
| Immigrants | Cabo Verde | 3.0 /100 | #247 | Tragic $43,963 |
| Nepalese | 2.6 /100 | #248 | Tragic $43,860 |
| Malaysians | 2.6 /100 | #249 | Tragic $43,844 |
| Alaska Natives | 2.3 /100 | #250 | Tragic $43,750 |
| Tsimshian | 2.1 /100 | #251 | Tragic $43,695 |
| Hawaiians | 2.0 /100 | #252 | Tragic $43,673 |
| Somalis | 1.8 /100 | #253 | Tragic $43,567 |