Turkish vs Finnish Median Earnings
COMPARE
Turkish
Finnish
Median Earnings
Median Earnings Comparison
Turks
Finns
$53,919
MEDIAN EARNINGS
100.0/ 100
METRIC RATING
25th/ 347
METRIC RANK
$45,940
MEDIAN EARNINGS
33.4/ 100
METRIC RATING
191st/ 347
METRIC RANK
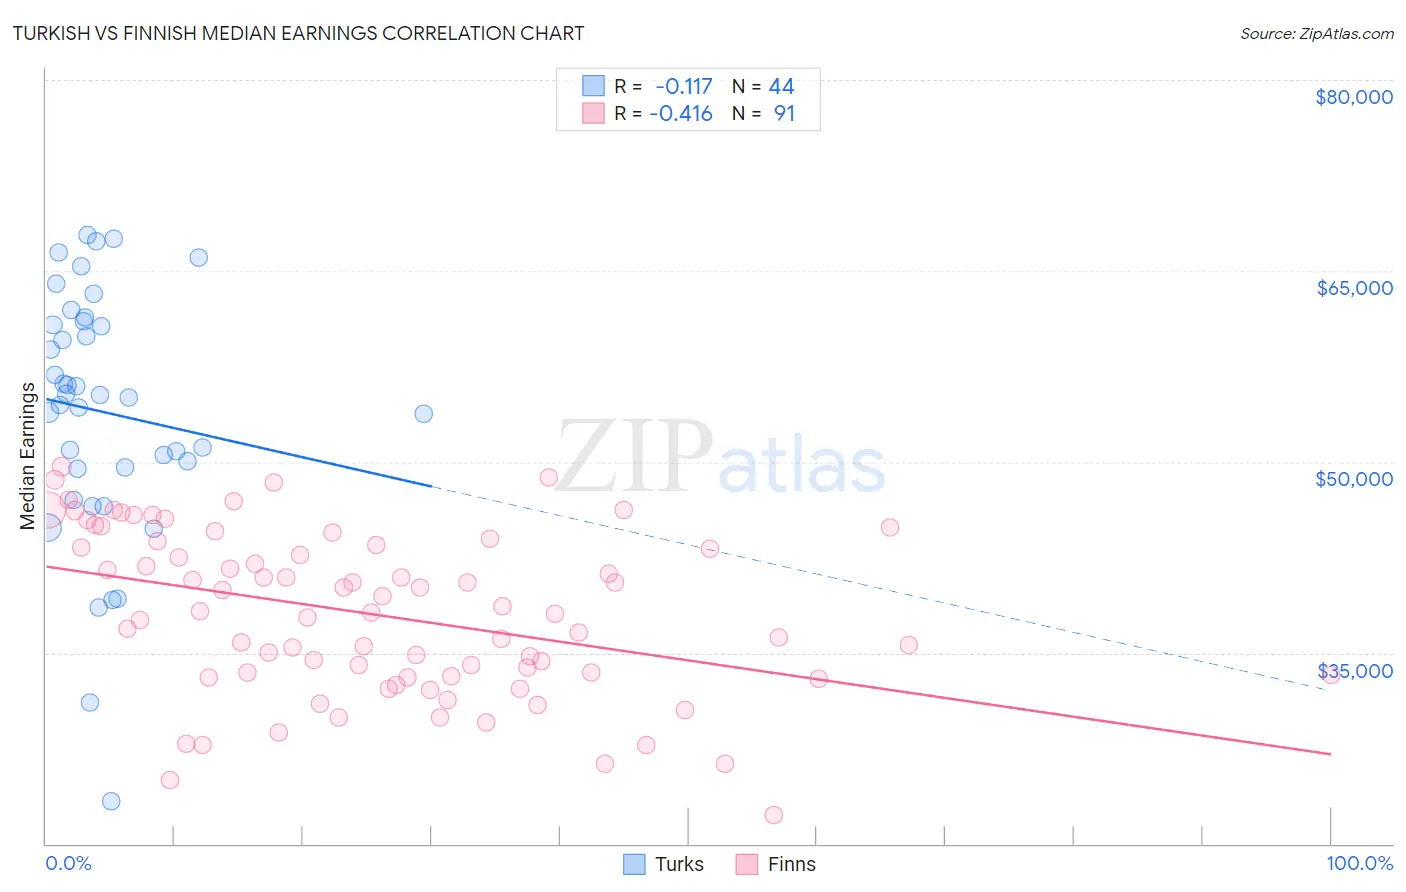
Turkish vs Finnish Median Earnings Correlation Chart
The statistical analysis conducted on geographies consisting of 271,840,547 people shows a poor negative correlation between the proportion of Turks and median earnings in the United States with a correlation coefficient (R) of -0.117 and weighted average of $53,919. Similarly, the statistical analysis conducted on geographies consisting of 404,629,884 people shows a moderate negative correlation between the proportion of Finns and median earnings in the United States with a correlation coefficient (R) of -0.416 and weighted average of $45,940, a difference of 17.4%.
Median Earnings Correlation Summary
| Measurement | Turkish | Finnish |
| Minimum | $23,333 | $22,232 |
| Maximum | $67,805 | $49,637 |
| Range | $44,472 | $27,405 |
| Mean | $53,919 | $38,029 |
| Median | $55,155 | $38,169 |
| Interquartile 25% (IQ1) | $49,523 | $33,167 |
| Interquartile 75% (IQ3) | $60,942 | $43,485 |
| Interquartile Range (IQR) | $11,419 | $10,318 |
| Standard Deviation (Sample) | $9,775 | $6,403 |
| Standard Deviation (Population) | $9,664 | $6,368 |
Similar Demographics by Median Earnings
Demographics Similar to Turks by Median Earnings
In terms of median earnings, the demographic groups most similar to Turks are Immigrants from Northern Europe ($53,872, a difference of 0.090%), Asian ($53,690, a difference of 0.43%), Soviet Union ($54,290, a difference of 0.69%), Immigrants from France ($53,490, a difference of 0.80%), and Immigrants from Russia ($53,457, a difference of 0.86%).
| Demographics | Rating | Rank | Median Earnings |
| Immigrants | Japan | 100.0 /100 | #18 | Exceptional $54,938 |
| Immigrants | Belgium | 100.0 /100 | #19 | Exceptional $54,679 |
| Cypriots | 100.0 /100 | #20 | Exceptional $54,589 |
| Burmese | 100.0 /100 | #21 | Exceptional $54,559 |
| Immigrants | Korea | 100.0 /100 | #22 | Exceptional $54,530 |
| Immigrants | Sweden | 100.0 /100 | #23 | Exceptional $54,478 |
| Soviet Union | 100.0 /100 | #24 | Exceptional $54,290 |
| Turks | 100.0 /100 | #25 | Exceptional $53,919 |
| Immigrants | Northern Europe | 100.0 /100 | #26 | Exceptional $53,872 |
| Asians | 100.0 /100 | #27 | Exceptional $53,690 |
| Immigrants | France | 100.0 /100 | #28 | Exceptional $53,490 |
| Immigrants | Russia | 100.0 /100 | #29 | Exceptional $53,457 |
| Cambodians | 100.0 /100 | #30 | Exceptional $53,386 |
| Russians | 100.0 /100 | #31 | Exceptional $53,334 |
| Immigrants | Asia | 100.0 /100 | #32 | Exceptional $53,310 |
Demographics Similar to Finns by Median Earnings
In terms of median earnings, the demographic groups most similar to Finns are German ($45,935, a difference of 0.010%), Guamanian/Chamorro ($45,933, a difference of 0.010%), Immigrants from Costa Rica ($45,928, a difference of 0.030%), Immigrants from St. Vincent and the Grenadines ($45,908, a difference of 0.070%), and French Canadian ($46,026, a difference of 0.19%).
| Demographics | Rating | Rank | Median Earnings |
| Immigrants | Kenya | 42.4 /100 | #184 | Average $46,214 |
| Uruguayans | 41.6 /100 | #185 | Average $46,190 |
| Vietnamese | 40.9 /100 | #186 | Average $46,172 |
| Iraqis | 39.9 /100 | #187 | Fair $46,140 |
| Immigrants | Armenia | 38.3 /100 | #188 | Fair $46,094 |
| Spaniards | 37.2 /100 | #189 | Fair $46,059 |
| French Canadians | 36.1 /100 | #190 | Fair $46,026 |
| Finns | 33.4 /100 | #191 | Fair $45,940 |
| Germans | 33.2 /100 | #192 | Fair $45,935 |
| Guamanians/Chamorros | 33.2 /100 | #193 | Fair $45,933 |
| Immigrants | Costa Rica | 33.0 /100 | #194 | Fair $45,928 |
| Immigrants | St. Vincent and the Grenadines | 32.4 /100 | #195 | Fair $45,908 |
| Yugoslavians | 30.5 /100 | #196 | Fair $45,846 |
| Barbadians | 30.5 /100 | #197 | Fair $45,846 |
| Trinidadians and Tobagonians | 29.7 /100 | #198 | Fair $45,820 |