Okinawan vs Immigrants from West Indies Median Earnings
COMPARE
Okinawan
Immigrants from West Indies
Median Earnings
Median Earnings Comparison
Okinawans
Immigrants from West Indies
$57,550
MEDIAN EARNINGS
100.0/ 100
METRIC RATING
9th/ 347
METRIC RANK
$43,989
MEDIAN EARNINGS
3.1/ 100
METRIC RATING
246th/ 347
METRIC RANK
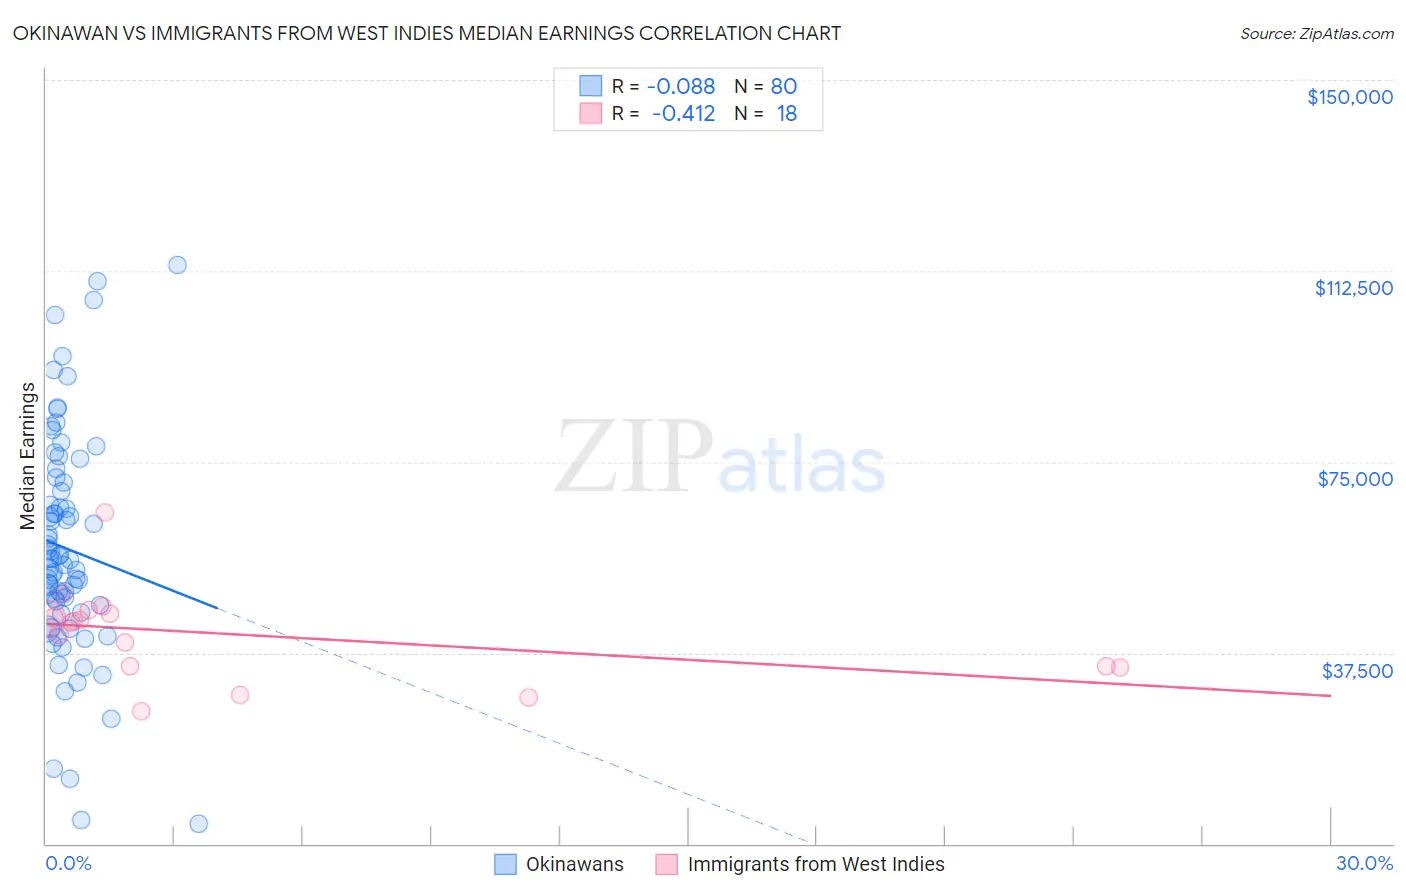
Okinawan vs Immigrants from West Indies Median Earnings Correlation Chart
The statistical analysis conducted on geographies consisting of 73,779,677 people shows a slight negative correlation between the proportion of Okinawans and median earnings in the United States with a correlation coefficient (R) of -0.088 and weighted average of $57,550. Similarly, the statistical analysis conducted on geographies consisting of 72,420,477 people shows a moderate negative correlation between the proportion of Immigrants from West Indies and median earnings in the United States with a correlation coefficient (R) of -0.412 and weighted average of $43,989, a difference of 30.8%.
Median Earnings Correlation Summary
| Measurement | Okinawan | Immigrants from West Indies |
| Minimum | $4,007 | $26,000 |
| Maximum | $113,728 | $64,982 |
| Range | $109,721 | $38,982 |
| Mean | $57,919 | $41,111 |
| Median | $55,875 | $43,487 |
| Interquartile 25% (IQ1) | $46,156 | $34,810 |
| Interquartile 75% (IQ3) | $70,001 | $45,119 |
| Interquartile Range (IQR) | $23,845 | $10,309 |
| Standard Deviation (Sample) | $21,992 | $9,035 |
| Standard Deviation (Population) | $21,854 | $8,780 |
Similar Demographics by Median Earnings
Demographics Similar to Okinawans by Median Earnings
In terms of median earnings, the demographic groups most similar to Okinawans are Immigrants from Iran ($57,612, a difference of 0.11%), Immigrants from South Central Asia ($57,114, a difference of 0.76%), Immigrants from Israel ($57,034, a difference of 0.90%), Immigrants from Ireland ($56,854, a difference of 1.2%), and Iranian ($58,474, a difference of 1.6%).
| Demographics | Rating | Rank | Median Earnings |
| Immigrants | Taiwan | 100.0 /100 | #2 | Exceptional $61,151 |
| Immigrants | India | 100.0 /100 | #3 | Exceptional $60,648 |
| Immigrants | Hong Kong | 100.0 /100 | #4 | Exceptional $59,433 |
| Thais | 100.0 /100 | #5 | Exceptional $59,237 |
| Immigrants | Singapore | 100.0 /100 | #6 | Exceptional $59,038 |
| Iranians | 100.0 /100 | #7 | Exceptional $58,474 |
| Immigrants | Iran | 100.0 /100 | #8 | Exceptional $57,612 |
| Okinawans | 100.0 /100 | #9 | Exceptional $57,550 |
| Immigrants | South Central Asia | 100.0 /100 | #10 | Exceptional $57,114 |
| Immigrants | Israel | 100.0 /100 | #11 | Exceptional $57,034 |
| Immigrants | Ireland | 100.0 /100 | #12 | Exceptional $56,854 |
| Immigrants | China | 100.0 /100 | #13 | Exceptional $56,638 |
| Immigrants | Australia | 100.0 /100 | #14 | Exceptional $56,305 |
| Indians (Asian) | 100.0 /100 | #15 | Exceptional $56,253 |
| Immigrants | Eastern Asia | 100.0 /100 | #16 | Exceptional $56,183 |
Demographics Similar to Immigrants from West Indies by Median Earnings
In terms of median earnings, the demographic groups most similar to Immigrants from West Indies are Immigrants from Burma/Myanmar ($43,998, a difference of 0.020%), Immigrants from Cabo Verde ($43,963, a difference of 0.060%), Subsaharan African ($44,118, a difference of 0.29%), Nonimmigrants ($44,117, a difference of 0.29%), and Nepalese ($43,860, a difference of 0.29%).
| Demographics | Rating | Rank | Median Earnings |
| Senegalese | 5.3 /100 | #239 | Tragic $44,373 |
| Aleuts | 4.4 /100 | #240 | Tragic $44,241 |
| Samoans | 4.2 /100 | #241 | Tragic $44,206 |
| Immigrants | Venezuela | 4.0 /100 | #242 | Tragic $44,163 |
| Sub-Saharan Africans | 3.7 /100 | #243 | Tragic $44,118 |
| Immigrants | Nonimmigrants | 3.7 /100 | #244 | Tragic $44,117 |
| Immigrants | Burma/Myanmar | 3.2 /100 | #245 | Tragic $43,998 |
| Immigrants | West Indies | 3.1 /100 | #246 | Tragic $43,989 |
| Immigrants | Cabo Verde | 3.0 /100 | #247 | Tragic $43,963 |
| Nepalese | 2.6 /100 | #248 | Tragic $43,860 |
| Malaysians | 2.6 /100 | #249 | Tragic $43,844 |
| Alaska Natives | 2.3 /100 | #250 | Tragic $43,750 |
| Tsimshian | 2.1 /100 | #251 | Tragic $43,695 |
| Hawaiians | 2.0 /100 | #252 | Tragic $43,673 |
| Somalis | 1.8 /100 | #253 | Tragic $43,567 |