Turkish vs Immigrants from West Indies Bachelor's Degree
COMPARE
Turkish
Immigrants from West Indies
Bachelor's Degree
Bachelor's Degree Comparison
Turks
Immigrants from West Indies
46.2%
BACHELOR'S DEGREE
100.0/ 100
METRIC RATING
28th/ 347
METRIC RANK
34.6%
BACHELOR'S DEGREE
2.9/ 100
METRIC RATING
235th/ 347
METRIC RANK
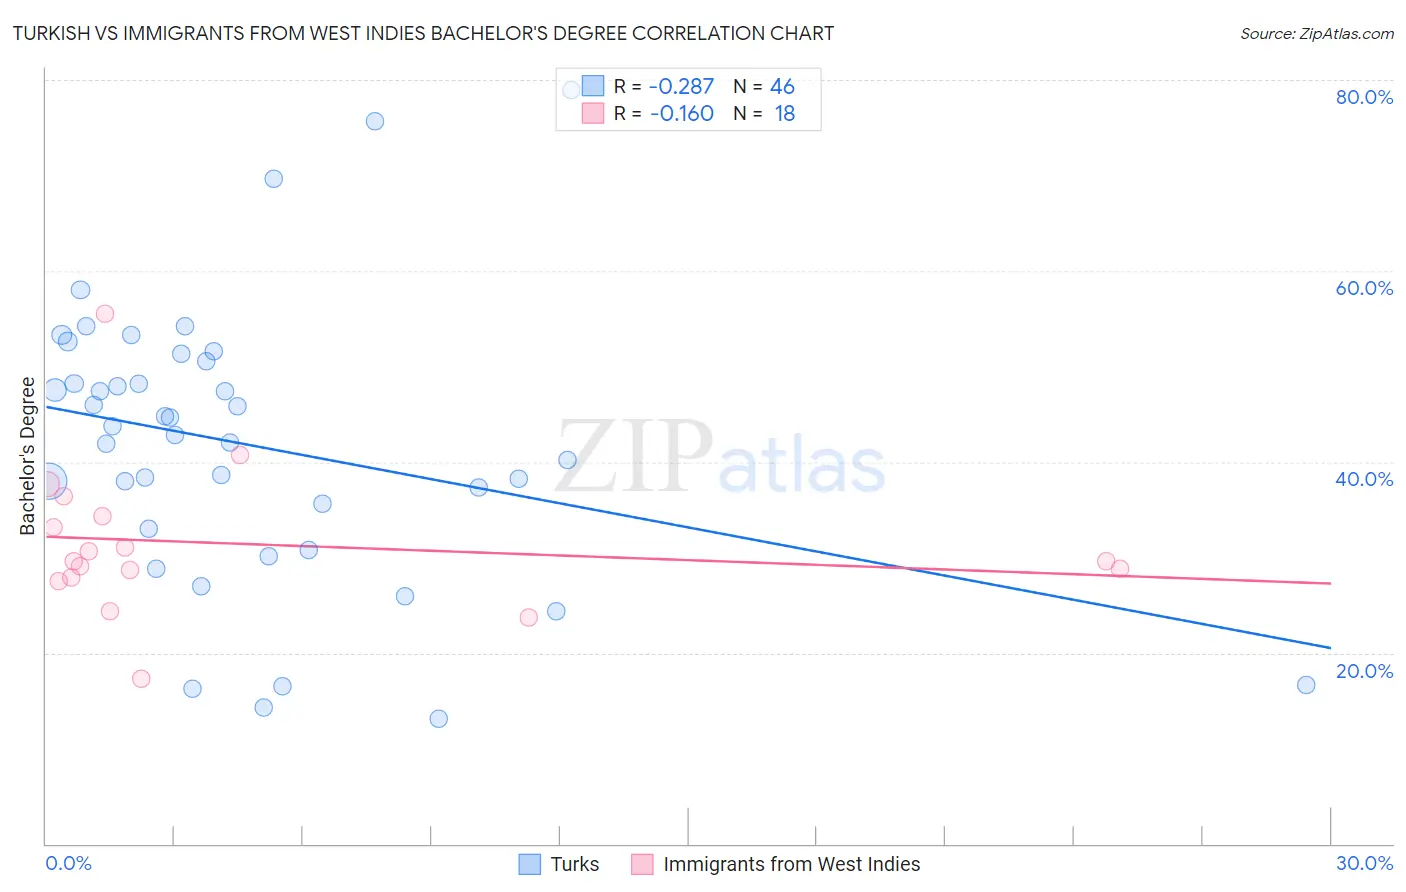
Turkish vs Immigrants from West Indies Bachelor's Degree Correlation Chart
The statistical analysis conducted on geographies consisting of 271,847,696 people shows a weak negative correlation between the proportion of Turks and percentage of population with at least bachelor's degree education in the United States with a correlation coefficient (R) of -0.287 and weighted average of 46.2%. Similarly, the statistical analysis conducted on geographies consisting of 72,420,477 people shows a poor negative correlation between the proportion of Immigrants from West Indies and percentage of population with at least bachelor's degree education in the United States with a correlation coefficient (R) of -0.160 and weighted average of 34.6%, a difference of 33.5%.
Bachelor's Degree Correlation Summary
| Measurement | Turkish | Immigrants from West Indies |
| Minimum | 13.1% | 17.2% |
| Maximum | 78.9% | 55.5% |
| Range | 65.8% | 38.3% |
| Mean | 41.8% | 31.4% |
| Median | 43.3% | 29.5% |
| Interquartile 25% (IQ1) | 33.0% | 27.8% |
| Interquartile 75% (IQ3) | 50.5% | 34.3% |
| Interquartile Range (IQR) | 17.5% | 6.4% |
| Standard Deviation (Sample) | 14.7% | 8.1% |
| Standard Deviation (Population) | 14.5% | 7.8% |
Similar Demographics by Bachelor's Degree
Demographics Similar to Turks by Bachelor's Degree
In terms of bachelor's degree, the demographic groups most similar to Turks are Israeli (46.1%, a difference of 0.13%), Immigrants from Sri Lanka (46.1%, a difference of 0.18%), Latvian (46.1%, a difference of 0.22%), Immigrants from France (46.4%, a difference of 0.46%), and Immigrants from Turkey (46.0%, a difference of 0.52%).
| Demographics | Rating | Rank | Bachelor's Degree |
| Immigrants | Ireland | 100.0 /100 | #21 | Exceptional 47.1% |
| Immigrants | Belgium | 100.0 /100 | #22 | Exceptional 47.0% |
| Immigrants | Sweden | 100.0 /100 | #23 | Exceptional 47.0% |
| Immigrants | Korea | 100.0 /100 | #24 | Exceptional 47.0% |
| Burmese | 100.0 /100 | #25 | Exceptional 46.9% |
| Immigrants | Japan | 100.0 /100 | #26 | Exceptional 46.8% |
| Immigrants | France | 100.0 /100 | #27 | Exceptional 46.4% |
| Turks | 100.0 /100 | #28 | Exceptional 46.2% |
| Israelis | 100.0 /100 | #29 | Exceptional 46.1% |
| Immigrants | Sri Lanka | 100.0 /100 | #30 | Exceptional 46.1% |
| Latvians | 100.0 /100 | #31 | Exceptional 46.1% |
| Immigrants | Turkey | 100.0 /100 | #32 | Exceptional 46.0% |
| Immigrants | Northern Europe | 100.0 /100 | #33 | Exceptional 45.6% |
| Immigrants | Denmark | 100.0 /100 | #34 | Exceptional 45.4% |
| Immigrants | Russia | 100.0 /100 | #35 | Exceptional 45.4% |
Demographics Similar to Immigrants from West Indies by Bachelor's Degree
In terms of bachelor's degree, the demographic groups most similar to Immigrants from West Indies are Guamanian/Chamorro (34.6%, a difference of 0.090%), Liberian (34.6%, a difference of 0.11%), Tlingit-Haida (34.6%, a difference of 0.14%), Immigrants from Ecuador (34.7%, a difference of 0.31%), and Hmong (34.8%, a difference of 0.42%).
| Demographics | Rating | Rank | Bachelor's Degree |
| Immigrants | Trinidad and Tobago | 6.0 /100 | #228 | Tragic 35.3% |
| Whites/Caucasians | 5.9 /100 | #229 | Tragic 35.3% |
| Immigrants | Grenada | 4.3 /100 | #230 | Tragic 35.0% |
| Immigrants | St. Vincent and the Grenadines | 4.3 /100 | #231 | Tragic 35.0% |
| Hmong | 3.4 /100 | #232 | Tragic 34.8% |
| Immigrants | Ecuador | 3.3 /100 | #233 | Tragic 34.7% |
| Guamanians/Chamorros | 3.0 /100 | #234 | Tragic 34.6% |
| Immigrants | West Indies | 2.9 /100 | #235 | Tragic 34.6% |
| Liberians | 2.8 /100 | #236 | Tragic 34.6% |
| Tlingit-Haida | 2.8 /100 | #237 | Tragic 34.6% |
| Guyanese | 2.5 /100 | #238 | Tragic 34.5% |
| British West Indians | 2.5 /100 | #239 | Tragic 34.5% |
| Tongans | 2.0 /100 | #240 | Tragic 34.3% |
| Immigrants | Cambodia | 1.9 /100 | #241 | Tragic 34.2% |
| Immigrants | Nonimmigrants | 1.8 /100 | #242 | Tragic 34.2% |