Assyrian/Chaldean/Syriac vs Immigrants from West Indies Median Earnings
COMPARE
Assyrian/Chaldean/Syriac
Immigrants from West Indies
Median Earnings
Median Earnings Comparison
Assyrians/Chaldeans/Syriacs
Immigrants from West Indies
$48,304
MEDIAN EARNINGS
93.3/ 100
METRIC RATING
126th/ 347
METRIC RANK
$43,989
MEDIAN EARNINGS
3.1/ 100
METRIC RATING
246th/ 347
METRIC RANK
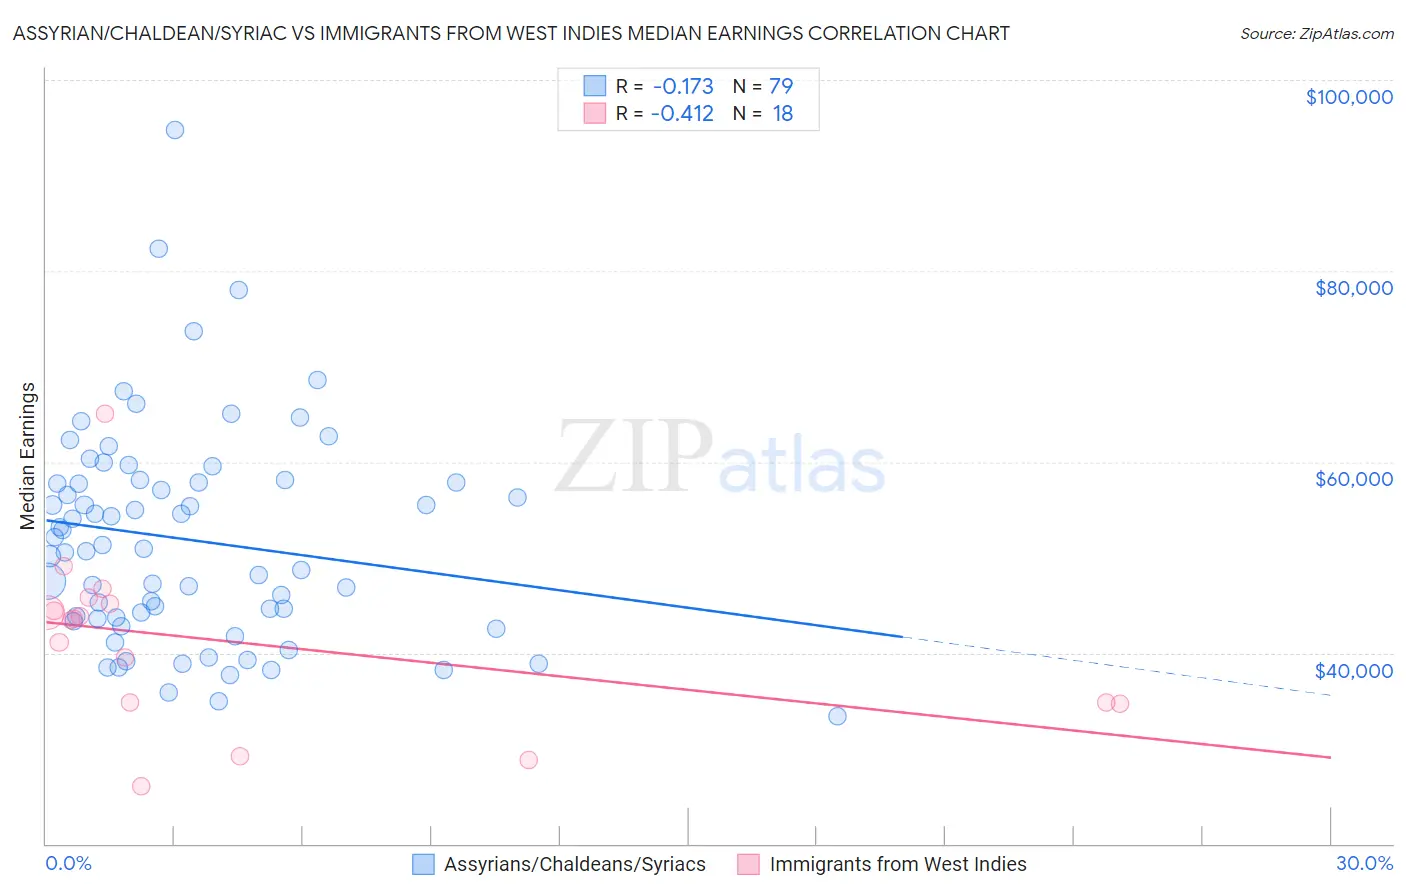
Assyrian/Chaldean/Syriac vs Immigrants from West Indies Median Earnings Correlation Chart
The statistical analysis conducted on geographies consisting of 110,275,669 people shows a poor negative correlation between the proportion of Assyrians/Chaldeans/Syriacs and median earnings in the United States with a correlation coefficient (R) of -0.173 and weighted average of $48,304. Similarly, the statistical analysis conducted on geographies consisting of 72,420,477 people shows a moderate negative correlation between the proportion of Immigrants from West Indies and median earnings in the United States with a correlation coefficient (R) of -0.412 and weighted average of $43,989, a difference of 9.8%.
Median Earnings Correlation Summary
| Measurement | Assyrian/Chaldean/Syriac | Immigrants from West Indies |
| Minimum | $33,351 | $26,000 |
| Maximum | $94,792 | $64,982 |
| Range | $61,441 | $38,982 |
| Mean | $51,833 | $41,111 |
| Median | $50,898 | $43,487 |
| Interquartile 25% (IQ1) | $43,507 | $34,810 |
| Interquartile 75% (IQ3) | $57,898 | $45,119 |
| Interquartile Range (IQR) | $14,391 | $10,309 |
| Standard Deviation (Sample) | $11,326 | $9,035 |
| Standard Deviation (Population) | $11,254 | $8,780 |
Similar Demographics by Median Earnings
Demographics Similar to Assyrians/Chaldeans/Syriacs by Median Earnings
In terms of median earnings, the demographic groups most similar to Assyrians/Chaldeans/Syriacs are Immigrants from Fiji ($48,305, a difference of 0.0%), Sierra Leonean ($48,286, a difference of 0.040%), Immigrants from Philippines ($48,266, a difference of 0.080%), Pakistani ($48,254, a difference of 0.10%), and Brazilian ($48,356, a difference of 0.11%).
| Demographics | Rating | Rank | Median Earnings |
| Poles | 95.8 /100 | #119 | Exceptional $48,659 |
| Carpatho Rusyns | 95.5 /100 | #120 | Exceptional $48,617 |
| Arabs | 95.4 /100 | #121 | Exceptional $48,599 |
| Chileans | 94.8 /100 | #122 | Exceptional $48,504 |
| Immigrants | Syria | 93.9 /100 | #123 | Exceptional $48,375 |
| Brazilians | 93.7 /100 | #124 | Exceptional $48,356 |
| Immigrants | Fiji | 93.3 /100 | #125 | Exceptional $48,305 |
| Assyrians/Chaldeans/Syriacs | 93.3 /100 | #126 | Exceptional $48,304 |
| Sierra Leoneans | 93.1 /100 | #127 | Exceptional $48,286 |
| Immigrants | Philippines | 92.9 /100 | #128 | Exceptional $48,266 |
| Pakistanis | 92.8 /100 | #129 | Exceptional $48,254 |
| Zimbabweans | 92.6 /100 | #130 | Exceptional $48,229 |
| Lebanese | 92.5 /100 | #131 | Exceptional $48,226 |
| British | 92.2 /100 | #132 | Exceptional $48,189 |
| Immigrants | Uganda | 90.5 /100 | #133 | Exceptional $48,041 |
Demographics Similar to Immigrants from West Indies by Median Earnings
In terms of median earnings, the demographic groups most similar to Immigrants from West Indies are Immigrants from Burma/Myanmar ($43,998, a difference of 0.020%), Immigrants from Cabo Verde ($43,963, a difference of 0.060%), Subsaharan African ($44,118, a difference of 0.29%), Nonimmigrants ($44,117, a difference of 0.29%), and Nepalese ($43,860, a difference of 0.29%).
| Demographics | Rating | Rank | Median Earnings |
| Senegalese | 5.3 /100 | #239 | Tragic $44,373 |
| Aleuts | 4.4 /100 | #240 | Tragic $44,241 |
| Samoans | 4.2 /100 | #241 | Tragic $44,206 |
| Immigrants | Venezuela | 4.0 /100 | #242 | Tragic $44,163 |
| Sub-Saharan Africans | 3.7 /100 | #243 | Tragic $44,118 |
| Immigrants | Nonimmigrants | 3.7 /100 | #244 | Tragic $44,117 |
| Immigrants | Burma/Myanmar | 3.2 /100 | #245 | Tragic $43,998 |
| Immigrants | West Indies | 3.1 /100 | #246 | Tragic $43,989 |
| Immigrants | Cabo Verde | 3.0 /100 | #247 | Tragic $43,963 |
| Nepalese | 2.6 /100 | #248 | Tragic $43,860 |
| Malaysians | 2.6 /100 | #249 | Tragic $43,844 |
| Alaska Natives | 2.3 /100 | #250 | Tragic $43,750 |
| Tsimshian | 2.1 /100 | #251 | Tragic $43,695 |
| Hawaiians | 2.0 /100 | #252 | Tragic $43,673 |
| Somalis | 1.8 /100 | #253 | Tragic $43,567 |