Turkish vs Immigrants from Singapore Median Earnings
COMPARE
Turkish
Immigrants from Singapore
Median Earnings
Median Earnings Comparison
Turks
Immigrants from Singapore
$53,919
MEDIAN EARNINGS
100.0/ 100
METRIC RATING
25th/ 347
METRIC RANK
$59,038
MEDIAN EARNINGS
100.0/ 100
METRIC RATING
6th/ 347
METRIC RANK
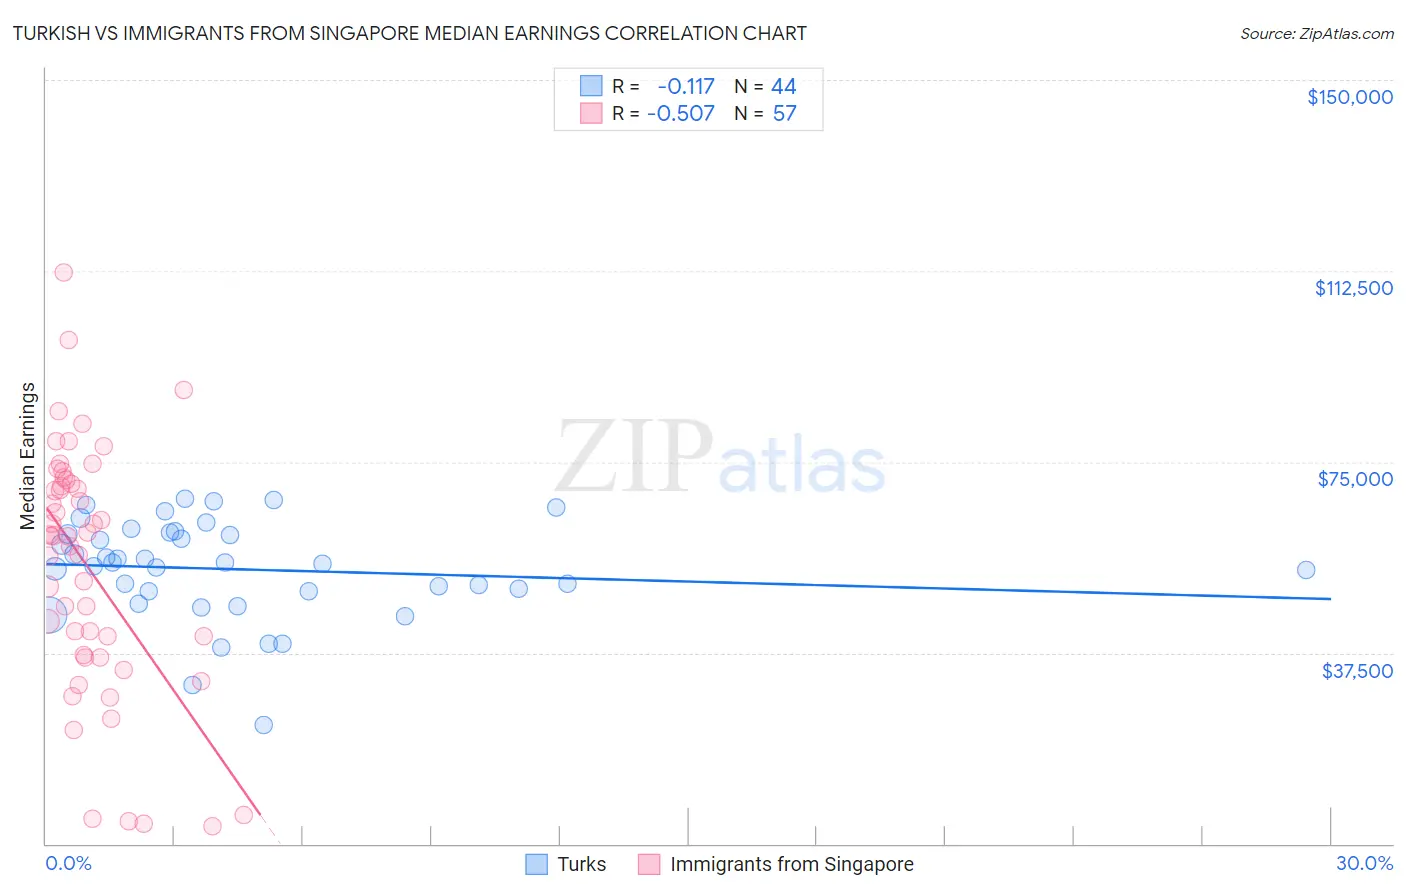
Turkish vs Immigrants from Singapore Median Earnings Correlation Chart
The statistical analysis conducted on geographies consisting of 271,840,547 people shows a poor negative correlation between the proportion of Turks and median earnings in the United States with a correlation coefficient (R) of -0.117 and weighted average of $53,919. Similarly, the statistical analysis conducted on geographies consisting of 137,505,488 people shows a substantial negative correlation between the proportion of Immigrants from Singapore and median earnings in the United States with a correlation coefficient (R) of -0.507 and weighted average of $59,038, a difference of 9.5%.
Median Earnings Correlation Summary
| Measurement | Turkish | Immigrants from Singapore |
| Minimum | $23,333 | $3,412 |
| Maximum | $67,805 | $112,087 |
| Range | $44,472 | $108,675 |
| Mean | $53,919 | $54,277 |
| Median | $55,155 | $60,355 |
| Interquartile 25% (IQ1) | $49,523 | $36,759 |
| Interquartile 75% (IQ3) | $60,942 | $71,145 |
| Interquartile Range (IQR) | $11,419 | $34,386 |
| Standard Deviation (Sample) | $9,775 | $24,368 |
| Standard Deviation (Population) | $9,664 | $24,153 |
Demographics Similar to Turks and Immigrants from Singapore by Median Earnings
In terms of median earnings, the demographic groups most similar to Turks are Soviet Union ($54,290, a difference of 0.69%), Immigrants from Sweden ($54,478, a difference of 1.0%), Immigrants from Korea ($54,530, a difference of 1.1%), Burmese ($54,559, a difference of 1.2%), and Cypriot ($54,589, a difference of 1.2%). Similarly, the demographic groups most similar to Immigrants from Singapore are Thai ($59,237, a difference of 0.34%), Iranian ($58,474, a difference of 0.97%), Immigrants from Iran ($57,612, a difference of 2.5%), Okinawan ($57,550, a difference of 2.6%), and Immigrants from South Central Asia ($57,114, a difference of 3.4%).
| Demographics | Rating | Rank | Median Earnings |
| Thais | 100.0 /100 | #5 | Exceptional $59,237 |
| Immigrants | Singapore | 100.0 /100 | #6 | Exceptional $59,038 |
| Iranians | 100.0 /100 | #7 | Exceptional $58,474 |
| Immigrants | Iran | 100.0 /100 | #8 | Exceptional $57,612 |
| Okinawans | 100.0 /100 | #9 | Exceptional $57,550 |
| Immigrants | South Central Asia | 100.0 /100 | #10 | Exceptional $57,114 |
| Immigrants | Israel | 100.0 /100 | #11 | Exceptional $57,034 |
| Immigrants | Ireland | 100.0 /100 | #12 | Exceptional $56,854 |
| Immigrants | China | 100.0 /100 | #13 | Exceptional $56,638 |
| Immigrants | Australia | 100.0 /100 | #14 | Exceptional $56,305 |
| Indians (Asian) | 100.0 /100 | #15 | Exceptional $56,253 |
| Immigrants | Eastern Asia | 100.0 /100 | #16 | Exceptional $56,183 |
| Eastern Europeans | 100.0 /100 | #17 | Exceptional $55,084 |
| Immigrants | Japan | 100.0 /100 | #18 | Exceptional $54,938 |
| Immigrants | Belgium | 100.0 /100 | #19 | Exceptional $54,679 |
| Cypriots | 100.0 /100 | #20 | Exceptional $54,589 |
| Burmese | 100.0 /100 | #21 | Exceptional $54,559 |
| Immigrants | Korea | 100.0 /100 | #22 | Exceptional $54,530 |
| Immigrants | Sweden | 100.0 /100 | #23 | Exceptional $54,478 |
| Soviet Union | 100.0 /100 | #24 | Exceptional $54,290 |
| Turks | 100.0 /100 | #25 | Exceptional $53,919 |