Turkish vs Immigrants from Bosnia and Herzegovina Median Earnings
COMPARE
Turkish
Immigrants from Bosnia and Herzegovina
Median Earnings
Median Earnings Comparison
Turks
Immigrants from Bosnia and Herzegovina
$53,919
MEDIAN EARNINGS
100.0/ 100
METRIC RATING
25th/ 347
METRIC RANK
$45,600
MEDIAN EARNINGS
23.7/ 100
METRIC RATING
208th/ 347
METRIC RANK
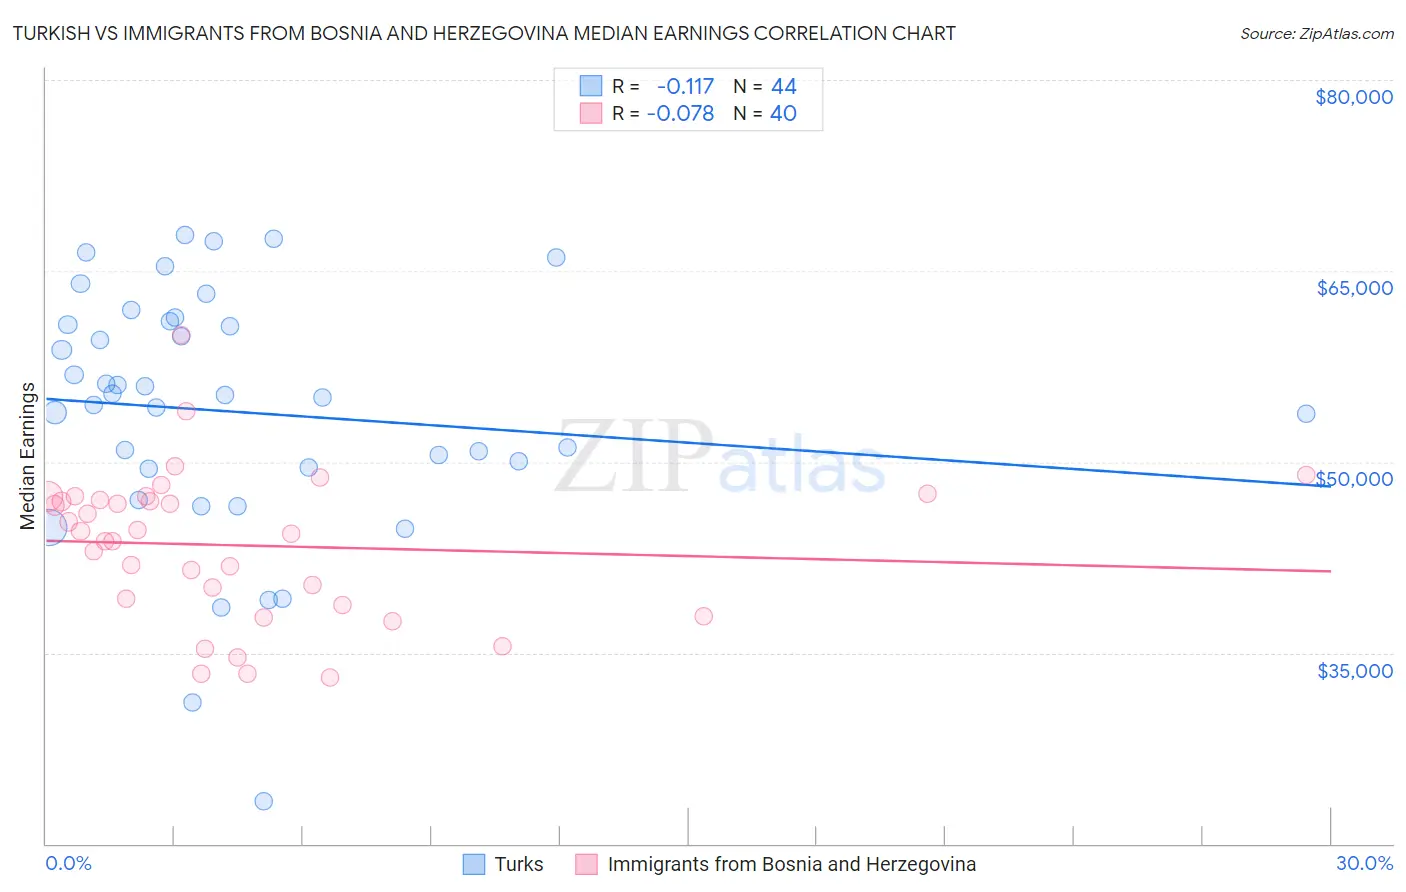
Turkish vs Immigrants from Bosnia and Herzegovina Median Earnings Correlation Chart
The statistical analysis conducted on geographies consisting of 271,840,547 people shows a poor negative correlation between the proportion of Turks and median earnings in the United States with a correlation coefficient (R) of -0.117 and weighted average of $53,919. Similarly, the statistical analysis conducted on geographies consisting of 156,807,140 people shows a slight negative correlation between the proportion of Immigrants from Bosnia and Herzegovina and median earnings in the United States with a correlation coefficient (R) of -0.078 and weighted average of $45,600, a difference of 18.2%.
Median Earnings Correlation Summary
| Measurement | Turkish | Immigrants from Bosnia and Herzegovina |
| Minimum | $23,333 | $33,044 |
| Maximum | $67,805 | $59,938 |
| Range | $44,472 | $26,894 |
| Mean | $53,919 | $43,428 |
| Median | $55,155 | $44,487 |
| Interquartile 25% (IQ1) | $49,523 | $39,026 |
| Interquartile 75% (IQ3) | $60,942 | $47,127 |
| Interquartile Range (IQR) | $11,419 | $8,100 |
| Standard Deviation (Sample) | $9,775 | $5,836 |
| Standard Deviation (Population) | $9,664 | $5,763 |
Similar Demographics by Median Earnings
Demographics Similar to Turks by Median Earnings
In terms of median earnings, the demographic groups most similar to Turks are Immigrants from Northern Europe ($53,872, a difference of 0.090%), Asian ($53,690, a difference of 0.43%), Soviet Union ($54,290, a difference of 0.69%), Immigrants from France ($53,490, a difference of 0.80%), and Immigrants from Russia ($53,457, a difference of 0.86%).
| Demographics | Rating | Rank | Median Earnings |
| Immigrants | Japan | 100.0 /100 | #18 | Exceptional $54,938 |
| Immigrants | Belgium | 100.0 /100 | #19 | Exceptional $54,679 |
| Cypriots | 100.0 /100 | #20 | Exceptional $54,589 |
| Burmese | 100.0 /100 | #21 | Exceptional $54,559 |
| Immigrants | Korea | 100.0 /100 | #22 | Exceptional $54,530 |
| Immigrants | Sweden | 100.0 /100 | #23 | Exceptional $54,478 |
| Soviet Union | 100.0 /100 | #24 | Exceptional $54,290 |
| Turks | 100.0 /100 | #25 | Exceptional $53,919 |
| Immigrants | Northern Europe | 100.0 /100 | #26 | Exceptional $53,872 |
| Asians | 100.0 /100 | #27 | Exceptional $53,690 |
| Immigrants | France | 100.0 /100 | #28 | Exceptional $53,490 |
| Immigrants | Russia | 100.0 /100 | #29 | Exceptional $53,457 |
| Cambodians | 100.0 /100 | #30 | Exceptional $53,386 |
| Russians | 100.0 /100 | #31 | Exceptional $53,334 |
| Immigrants | Asia | 100.0 /100 | #32 | Exceptional $53,310 |
Demographics Similar to Immigrants from Bosnia and Herzegovina by Median Earnings
In terms of median earnings, the demographic groups most similar to Immigrants from Bosnia and Herzegovina are Immigrants from Thailand ($45,598, a difference of 0.0%), Immigrants from Grenada ($45,596, a difference of 0.010%), Panamanian ($45,593, a difference of 0.010%), Bermudan ($45,593, a difference of 0.010%), and Immigrants from Senegal ($45,611, a difference of 0.020%).
| Demographics | Rating | Rank | Median Earnings |
| Celtics | 27.2 /100 | #201 | Fair $45,732 |
| Immigrants | Trinidad and Tobago | 27.1 /100 | #202 | Fair $45,729 |
| Welsh | 26.6 /100 | #203 | Fair $45,710 |
| Immigrants | Uruguay | 25.9 /100 | #204 | Fair $45,682 |
| Tongans | 25.4 /100 | #205 | Fair $45,665 |
| Immigrants | Ghana | 24.8 /100 | #206 | Fair $45,641 |
| Immigrants | Senegal | 24.0 /100 | #207 | Fair $45,611 |
| Immigrants | Bosnia and Herzegovina | 23.7 /100 | #208 | Fair $45,600 |
| Immigrants | Thailand | 23.7 /100 | #209 | Fair $45,598 |
| Immigrants | Grenada | 23.6 /100 | #210 | Fair $45,596 |
| Panamanians | 23.5 /100 | #211 | Fair $45,593 |
| Bermudans | 23.5 /100 | #212 | Fair $45,593 |
| Immigrants | Colombia | 22.4 /100 | #213 | Fair $45,550 |
| Nigerians | 22.0 /100 | #214 | Fair $45,532 |
| Immigrants | Bangladesh | 22.0 /100 | #215 | Fair $45,532 |