U.S. Virgin Islander vs Yugoslavian Householder Income Over 65 years
COMPARE
U.S. Virgin Islander
Yugoslavian
Householder Income Over 65 years
Householder Income Over 65 years Comparison
U.S. Virgin Islanders
Yugoslavians
$52,072
HOUSEHOLDER INCOME OVER 65 YEARS
0.0/ 100
METRIC RATING
315th/ 347
METRIC RANK
$58,243
HOUSEHOLDER INCOME OVER 65 YEARS
5.5/ 100
METRIC RATING
220th/ 347
METRIC RANK
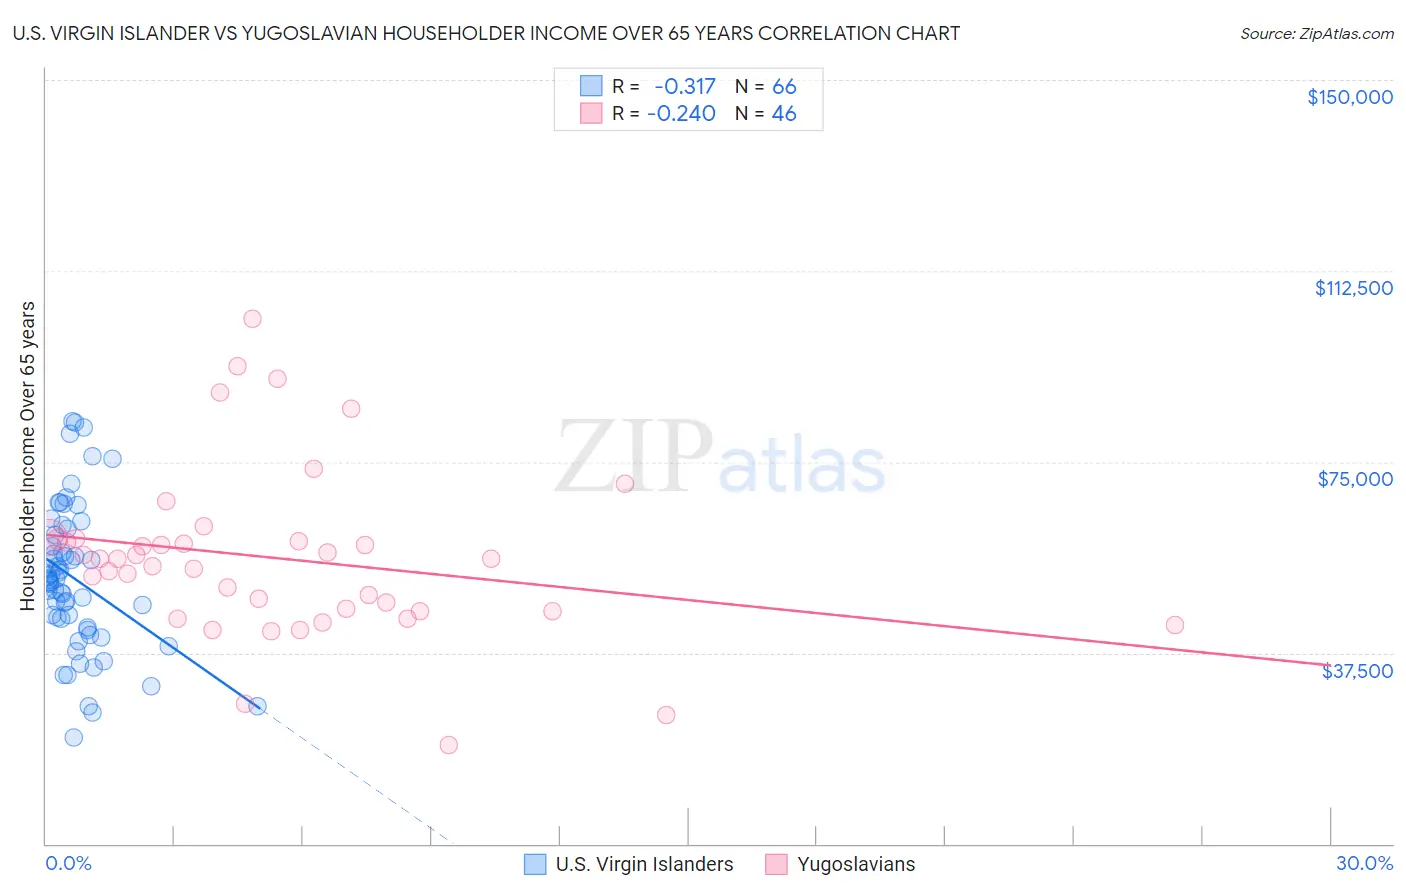
U.S. Virgin Islander vs Yugoslavian Householder Income Over 65 years Correlation Chart
The statistical analysis conducted on geographies consisting of 87,439,612 people shows a mild negative correlation between the proportion of U.S. Virgin Islanders and household income with householder over the age of 65 in the United States with a correlation coefficient (R) of -0.317 and weighted average of $52,072. Similarly, the statistical analysis conducted on geographies consisting of 285,278,899 people shows a weak negative correlation between the proportion of Yugoslavians and household income with householder over the age of 65 in the United States with a correlation coefficient (R) of -0.240 and weighted average of $58,243, a difference of 11.8%.
Householder Income Over 65 years Correlation Summary
| Measurement | U.S. Virgin Islander | Yugoslavian |
| Minimum | $20,842 | $19,307 |
| Maximum | $83,077 | $103,095 |
| Range | $62,235 | $83,788 |
| Mean | $51,986 | $56,075 |
| Median | $51,771 | $55,920 |
| Interquartile 25% (IQ1) | $42,565 | $45,775 |
| Interquartile 75% (IQ3) | $60,681 | $59,846 |
| Interquartile Range (IQR) | $18,116 | $14,071 |
| Standard Deviation (Sample) | $14,250 | $16,651 |
| Standard Deviation (Population) | $14,142 | $16,469 |
Similar Demographics by Householder Income Over 65 years
Demographics Similar to U.S. Virgin Islanders by Householder Income Over 65 years
In terms of householder income over 65 years, the demographic groups most similar to U.S. Virgin Islanders are Immigrants from Nicaragua ($52,085, a difference of 0.020%), Native/Alaskan ($52,081, a difference of 0.020%), Immigrants from the Azores ($52,121, a difference of 0.090%), Creek ($51,949, a difference of 0.24%), and Immigrants from St. Vincent and the Grenadines ($51,922, a difference of 0.29%).
| Demographics | Rating | Rank | Householder Income Over 65 years |
| Immigrants | Mexico | 0.0 /100 | #308 | Tragic $52,801 |
| Hondurans | 0.0 /100 | #309 | Tragic $52,634 |
| Sioux | 0.0 /100 | #310 | Tragic $52,509 |
| Seminole | 0.0 /100 | #311 | Tragic $52,373 |
| Immigrants | Azores | 0.0 /100 | #312 | Tragic $52,121 |
| Immigrants | Nicaragua | 0.0 /100 | #313 | Tragic $52,085 |
| Natives/Alaskans | 0.0 /100 | #314 | Tragic $52,081 |
| U.S. Virgin Islanders | 0.0 /100 | #315 | Tragic $52,072 |
| Creek | 0.0 /100 | #316 | Tragic $51,949 |
| Immigrants | St. Vincent and the Grenadines | 0.0 /100 | #317 | Tragic $51,922 |
| Haitians | 0.0 /100 | #318 | Tragic $51,912 |
| Immigrants | Honduras | 0.0 /100 | #319 | Tragic $51,888 |
| Colville | 0.0 /100 | #320 | Tragic $51,739 |
| Menominee | 0.0 /100 | #321 | Tragic $51,719 |
| British West Indians | 0.0 /100 | #322 | Tragic $51,463 |
Demographics Similar to Yugoslavians by Householder Income Over 65 years
In terms of householder income over 65 years, the demographic groups most similar to Yugoslavians are Malaysian ($58,244, a difference of 0.0%), Immigrants from El Salvador ($58,226, a difference of 0.030%), Panamanian ($58,266, a difference of 0.040%), Delaware ($58,214, a difference of 0.050%), and Sudanese ($58,281, a difference of 0.070%).
| Demographics | Rating | Rank | Householder Income Over 65 years |
| Whites/Caucasians | 9.8 /100 | #213 | Tragic $58,847 |
| Nepalese | 9.0 /100 | #214 | Tragic $58,761 |
| Immigrants | Ghana | 7.9 /100 | #215 | Tragic $58,624 |
| Immigrants | Middle Africa | 6.2 /100 | #216 | Tragic $58,375 |
| Sudanese | 5.7 /100 | #217 | Tragic $58,281 |
| Panamanians | 5.6 /100 | #218 | Tragic $58,266 |
| Malaysians | 5.5 /100 | #219 | Tragic $58,244 |
| Yugoslavians | 5.5 /100 | #220 | Tragic $58,243 |
| Immigrants | El Salvador | 5.4 /100 | #221 | Tragic $58,226 |
| Delaware | 5.3 /100 | #222 | Tragic $58,214 |
| Tsimshian | 5.2 /100 | #223 | Tragic $58,202 |
| Bermudans | 5.1 /100 | #224 | Tragic $58,171 |
| Venezuelans | 4.4 /100 | #225 | Tragic $58,026 |
| French Canadians | 4.2 /100 | #226 | Tragic $57,975 |
| Japanese | 3.9 /100 | #227 | Tragic $57,919 |