Immigrants from Grenada vs Yugoslavian Householder Income Over 65 years
COMPARE
Immigrants from Grenada
Yugoslavian
Householder Income Over 65 years
Householder Income Over 65 years Comparison
Immigrants from Grenada
Yugoslavians
$50,747
HOUSEHOLDER INCOME OVER 65 YEARS
0.0/ 100
METRIC RATING
330th/ 347
METRIC RANK
$58,243
HOUSEHOLDER INCOME OVER 65 YEARS
5.5/ 100
METRIC RATING
220th/ 347
METRIC RANK
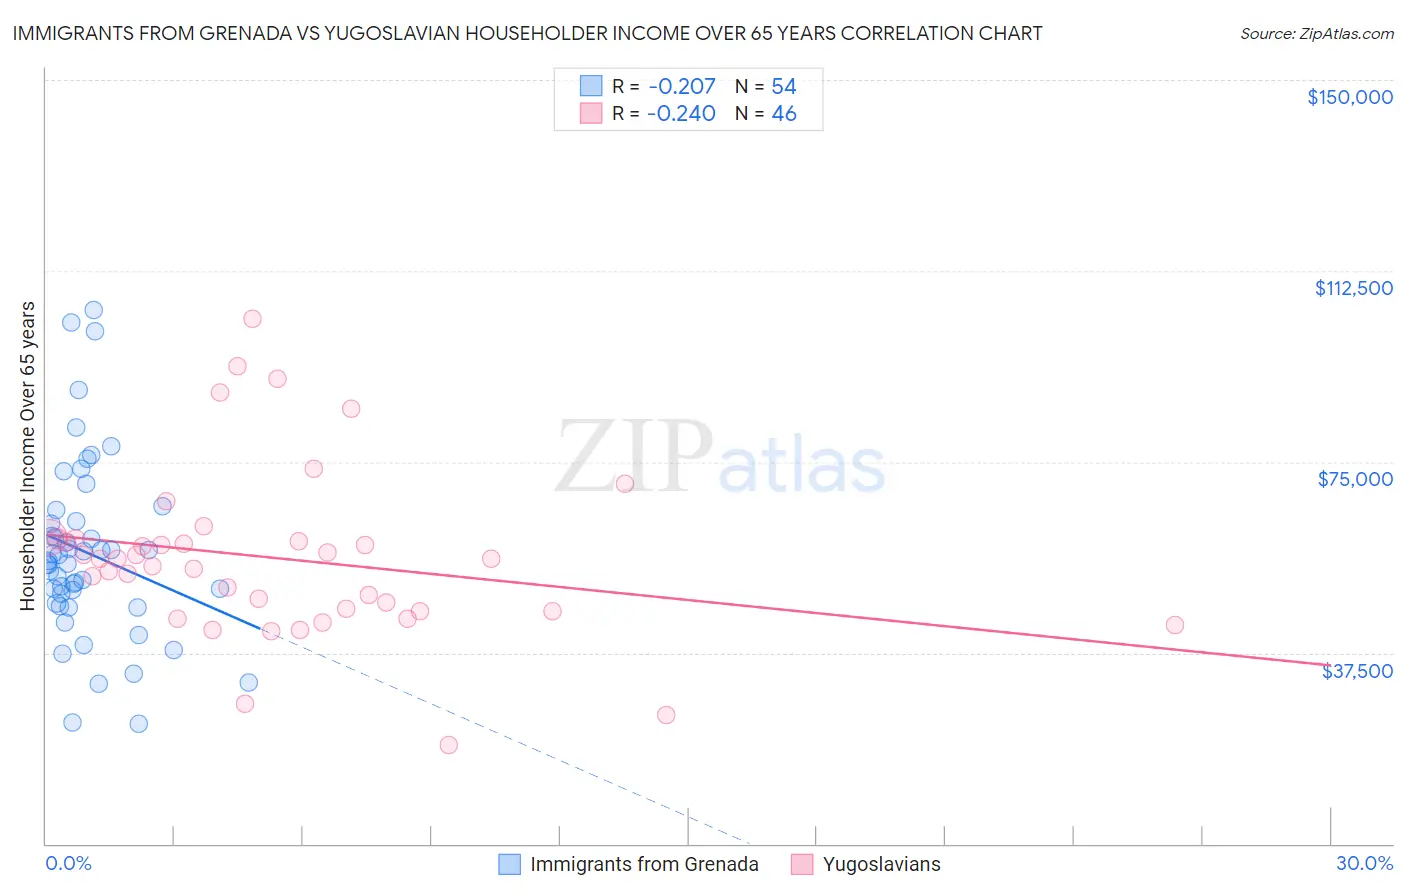
Immigrants from Grenada vs Yugoslavian Householder Income Over 65 years Correlation Chart
The statistical analysis conducted on geographies consisting of 67,113,016 people shows a weak negative correlation between the proportion of Immigrants from Grenada and household income with householder over the age of 65 in the United States with a correlation coefficient (R) of -0.207 and weighted average of $50,747. Similarly, the statistical analysis conducted on geographies consisting of 285,278,899 people shows a weak negative correlation between the proportion of Yugoslavians and household income with householder over the age of 65 in the United States with a correlation coefficient (R) of -0.240 and weighted average of $58,243, a difference of 14.8%.
Householder Income Over 65 years Correlation Summary
| Measurement | Immigrants from Grenada | Yugoslavian |
| Minimum | $23,659 | $19,307 |
| Maximum | $104,885 | $103,095 |
| Range | $81,226 | $83,788 |
| Mean | $57,145 | $56,075 |
| Median | $55,323 | $55,920 |
| Interquartile 25% (IQ1) | $47,246 | $45,775 |
| Interquartile 75% (IQ3) | $63,328 | $59,846 |
| Interquartile Range (IQR) | $16,082 | $14,071 |
| Standard Deviation (Sample) | $17,613 | $16,651 |
| Standard Deviation (Population) | $17,450 | $16,469 |
Similar Demographics by Householder Income Over 65 years
Demographics Similar to Immigrants from Grenada by Householder Income Over 65 years
In terms of householder income over 65 years, the demographic groups most similar to Immigrants from Grenada are Black/African American ($50,779, a difference of 0.060%), Hopi ($50,925, a difference of 0.35%), Pima ($50,539, a difference of 0.41%), Bahamian ($51,000, a difference of 0.50%), and Dutch West Indian ($50,475, a difference of 0.54%).
| Demographics | Rating | Rank | Householder Income Over 65 years |
| Cajuns | 0.0 /100 | #323 | Tragic $51,397 |
| Immigrants | Congo | 0.0 /100 | #324 | Tragic $51,393 |
| Immigrants | Haiti | 0.0 /100 | #325 | Tragic $51,219 |
| Kiowa | 0.0 /100 | #326 | Tragic $51,140 |
| Bahamians | 0.0 /100 | #327 | Tragic $51,000 |
| Hopi | 0.0 /100 | #328 | Tragic $50,925 |
| Blacks/African Americans | 0.0 /100 | #329 | Tragic $50,779 |
| Immigrants | Grenada | 0.0 /100 | #330 | Tragic $50,747 |
| Pima | 0.0 /100 | #331 | Tragic $50,539 |
| Dutch West Indians | 0.0 /100 | #332 | Tragic $50,475 |
| Cape Verdeans | 0.0 /100 | #333 | Tragic $50,077 |
| Immigrants | Dominica | 0.0 /100 | #334 | Tragic $50,071 |
| Crow | 0.0 /100 | #335 | Tragic $49,234 |
| Cubans | 0.0 /100 | #336 | Tragic $49,152 |
| Tohono O'odham | 0.0 /100 | #337 | Tragic $49,121 |
Demographics Similar to Yugoslavians by Householder Income Over 65 years
In terms of householder income over 65 years, the demographic groups most similar to Yugoslavians are Malaysian ($58,244, a difference of 0.0%), Immigrants from El Salvador ($58,226, a difference of 0.030%), Panamanian ($58,266, a difference of 0.040%), Delaware ($58,214, a difference of 0.050%), and Sudanese ($58,281, a difference of 0.070%).
| Demographics | Rating | Rank | Householder Income Over 65 years |
| Whites/Caucasians | 9.8 /100 | #213 | Tragic $58,847 |
| Nepalese | 9.0 /100 | #214 | Tragic $58,761 |
| Immigrants | Ghana | 7.9 /100 | #215 | Tragic $58,624 |
| Immigrants | Middle Africa | 6.2 /100 | #216 | Tragic $58,375 |
| Sudanese | 5.7 /100 | #217 | Tragic $58,281 |
| Panamanians | 5.6 /100 | #218 | Tragic $58,266 |
| Malaysians | 5.5 /100 | #219 | Tragic $58,244 |
| Yugoslavians | 5.5 /100 | #220 | Tragic $58,243 |
| Immigrants | El Salvador | 5.4 /100 | #221 | Tragic $58,226 |
| Delaware | 5.3 /100 | #222 | Tragic $58,214 |
| Tsimshian | 5.2 /100 | #223 | Tragic $58,202 |
| Bermudans | 5.1 /100 | #224 | Tragic $58,171 |
| Venezuelans | 4.4 /100 | #225 | Tragic $58,026 |
| French Canadians | 4.2 /100 | #226 | Tragic $57,975 |
| Japanese | 3.9 /100 | #227 | Tragic $57,919 |