Arapaho vs Yugoslavian Householder Income Over 65 years
COMPARE
Arapaho
Yugoslavian
Householder Income Over 65 years
Householder Income Over 65 years Comparison
Arapaho
Yugoslavians
$59,383
HOUSEHOLDER INCOME OVER 65 YEARS
16.0/ 100
METRIC RATING
204th/ 347
METRIC RANK
$58,243
HOUSEHOLDER INCOME OVER 65 YEARS
5.5/ 100
METRIC RATING
220th/ 347
METRIC RANK
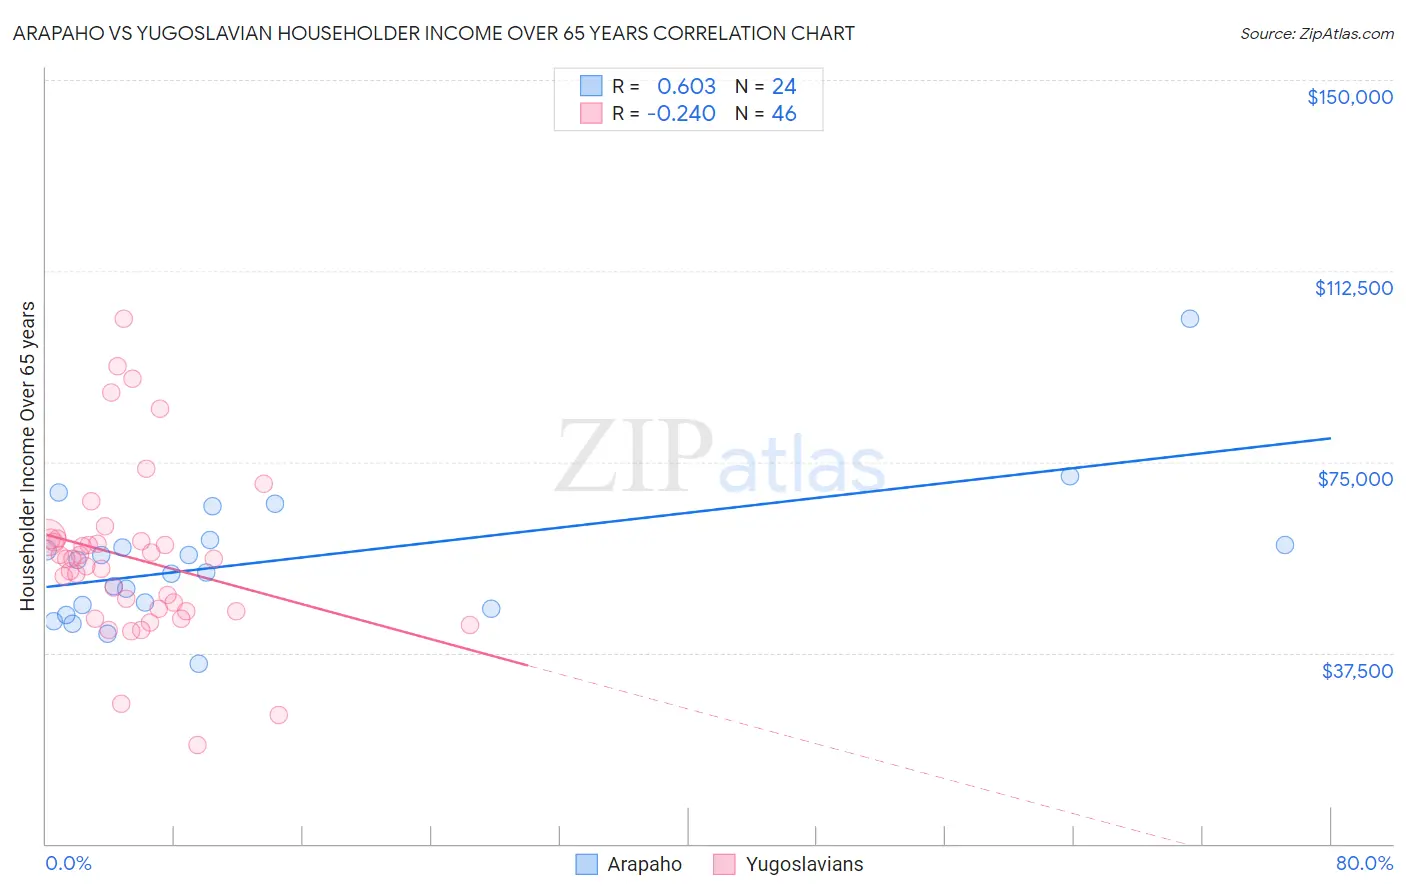
Arapaho vs Yugoslavian Householder Income Over 65 years Correlation Chart
The statistical analysis conducted on geographies consisting of 29,739,180 people shows a significant positive correlation between the proportion of Arapaho and household income with householder over the age of 65 in the United States with a correlation coefficient (R) of 0.603 and weighted average of $59,383. Similarly, the statistical analysis conducted on geographies consisting of 285,278,899 people shows a weak negative correlation between the proportion of Yugoslavians and household income with householder over the age of 65 in the United States with a correlation coefficient (R) of -0.240 and weighted average of $58,243, a difference of 2.0%.
Householder Income Over 65 years Correlation Summary
| Measurement | Arapaho | Yugoslavian |
| Minimum | $35,366 | $19,307 |
| Maximum | $103,036 | $103,095 |
| Range | $67,670 | $83,788 |
| Mean | $55,690 | $56,075 |
| Median | $54,436 | $55,920 |
| Interquartile 25% (IQ1) | $46,442 | $45,775 |
| Interquartile 75% (IQ3) | $59,194 | $59,846 |
| Interquartile Range (IQR) | $12,751 | $14,071 |
| Standard Deviation (Sample) | $13,684 | $16,651 |
| Standard Deviation (Population) | $13,396 | $16,469 |
Demographics Similar to Arapaho and Yugoslavians by Householder Income Over 65 years
In terms of householder income over 65 years, the demographic groups most similar to Arapaho are Scotch-Irish ($59,447, a difference of 0.11%), Immigrants from Sudan ($59,248, a difference of 0.23%), Finnish ($59,535, a difference of 0.25%), Immigrants from South America ($59,151, a difference of 0.39%), and Salvadoran ($59,141, a difference of 0.41%). Similarly, the demographic groups most similar to Yugoslavians are Malaysian ($58,244, a difference of 0.0%), Immigrants from El Salvador ($58,226, a difference of 0.030%), Panamanian ($58,266, a difference of 0.040%), Delaware ($58,214, a difference of 0.050%), and Sudanese ($58,281, a difference of 0.070%).
| Demographics | Rating | Rank | Householder Income Over 65 years |
| Finns | 18.2 /100 | #202 | Poor $59,535 |
| Scotch-Irish | 16.9 /100 | #203 | Poor $59,447 |
| Arapaho | 16.0 /100 | #204 | Poor $59,383 |
| Immigrants | Sudan | 14.2 /100 | #205 | Poor $59,248 |
| Immigrants | South America | 13.0 /100 | #206 | Poor $59,151 |
| Salvadorans | 12.9 /100 | #207 | Poor $59,141 |
| Uruguayans | 12.3 /100 | #208 | Poor $59,090 |
| Slovaks | 11.7 /100 | #209 | Poor $59,039 |
| Nigerians | 11.2 /100 | #210 | Poor $58,992 |
| Immigrants | Nigeria | 10.7 /100 | #211 | Poor $58,942 |
| Colombians | 9.8 /100 | #212 | Tragic $58,851 |
| Whites/Caucasians | 9.8 /100 | #213 | Tragic $58,847 |
| Nepalese | 9.0 /100 | #214 | Tragic $58,761 |
| Immigrants | Ghana | 7.9 /100 | #215 | Tragic $58,624 |
| Immigrants | Middle Africa | 6.2 /100 | #216 | Tragic $58,375 |
| Sudanese | 5.7 /100 | #217 | Tragic $58,281 |
| Panamanians | 5.6 /100 | #218 | Tragic $58,266 |
| Malaysians | 5.5 /100 | #219 | Tragic $58,244 |
| Yugoslavians | 5.5 /100 | #220 | Tragic $58,243 |
| Immigrants | El Salvador | 5.4 /100 | #221 | Tragic $58,226 |
| Delaware | 5.3 /100 | #222 | Tragic $58,214 |